Introduction
The target reservoir, located onshore, consists of sandstones with an average porosity of 28% and air permeability of 5800 mD. The reservoir contains heavy oil with a viscosity of 194 cP and mobility index of 30 mD/cP. Natural drive energy is weak, and production is supported by continuous water injection; recovery efficiency under waterflood is estimated at 31%.
The DAKS™ Analogue Workflow
The DAKS™ Analogue Workflow (Fig. 1) was used to evaluate EOR potential for a clastic heavy oil reservoir and validate viable EOR methods.
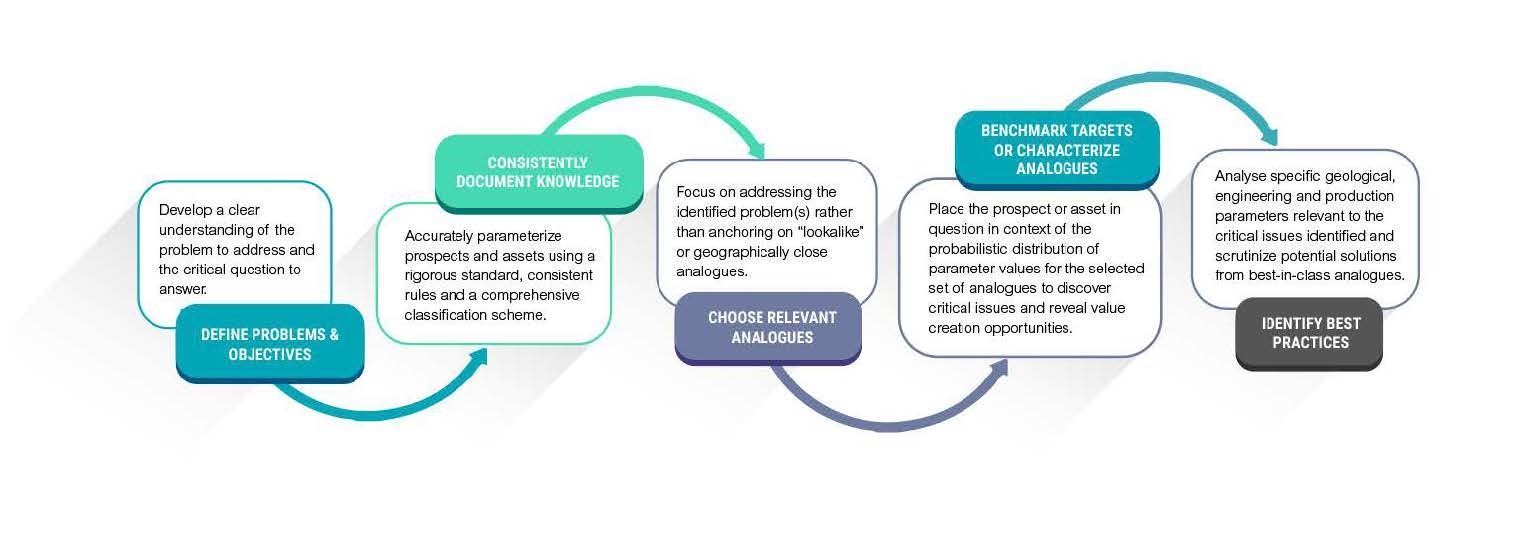
Fig. 1 – Flow chart illustrating key steps in the analog benchmarking workflow and summarizing the requirements at each step.
Step 1: Define Problems and Objectives
The operator is currently evaluating options for enhanced oil recovery and wants to understand best practices from global analogues, specifically in the following areas:
- Thermal vs chemical flood
- Incremental recovery and ultimate recovery factor
- Production/injection performance
Step 2: Consistently Document Knowledge
Based on public domain data sources, both text and numeric parameters have been standardized and classified using the consistent rules defined by C&C Reservoir’s comprehensive classification scheme. This standardization ensures that accurate comparisons can be drawn from directly comparable analogues contained within the DAKS™ knowledge base.
Step 3: Choose Relevant Analogues
The following selection criteria (Table 1) have been used to identify appropriate analogues. From these criteria, 34 applicable global analogues were identified.

Table 1 – Analogue search criteria for the target reservoir EOR evaluation.
Step 4: Benchmark Target or Characterize Analogues
Calibrate Waterflood Recovery
Benchmarking the target reservoir against the selected global analogues shows that expected recovery factor under waterflood is on-trend with relevant analogues (Fig. 2).
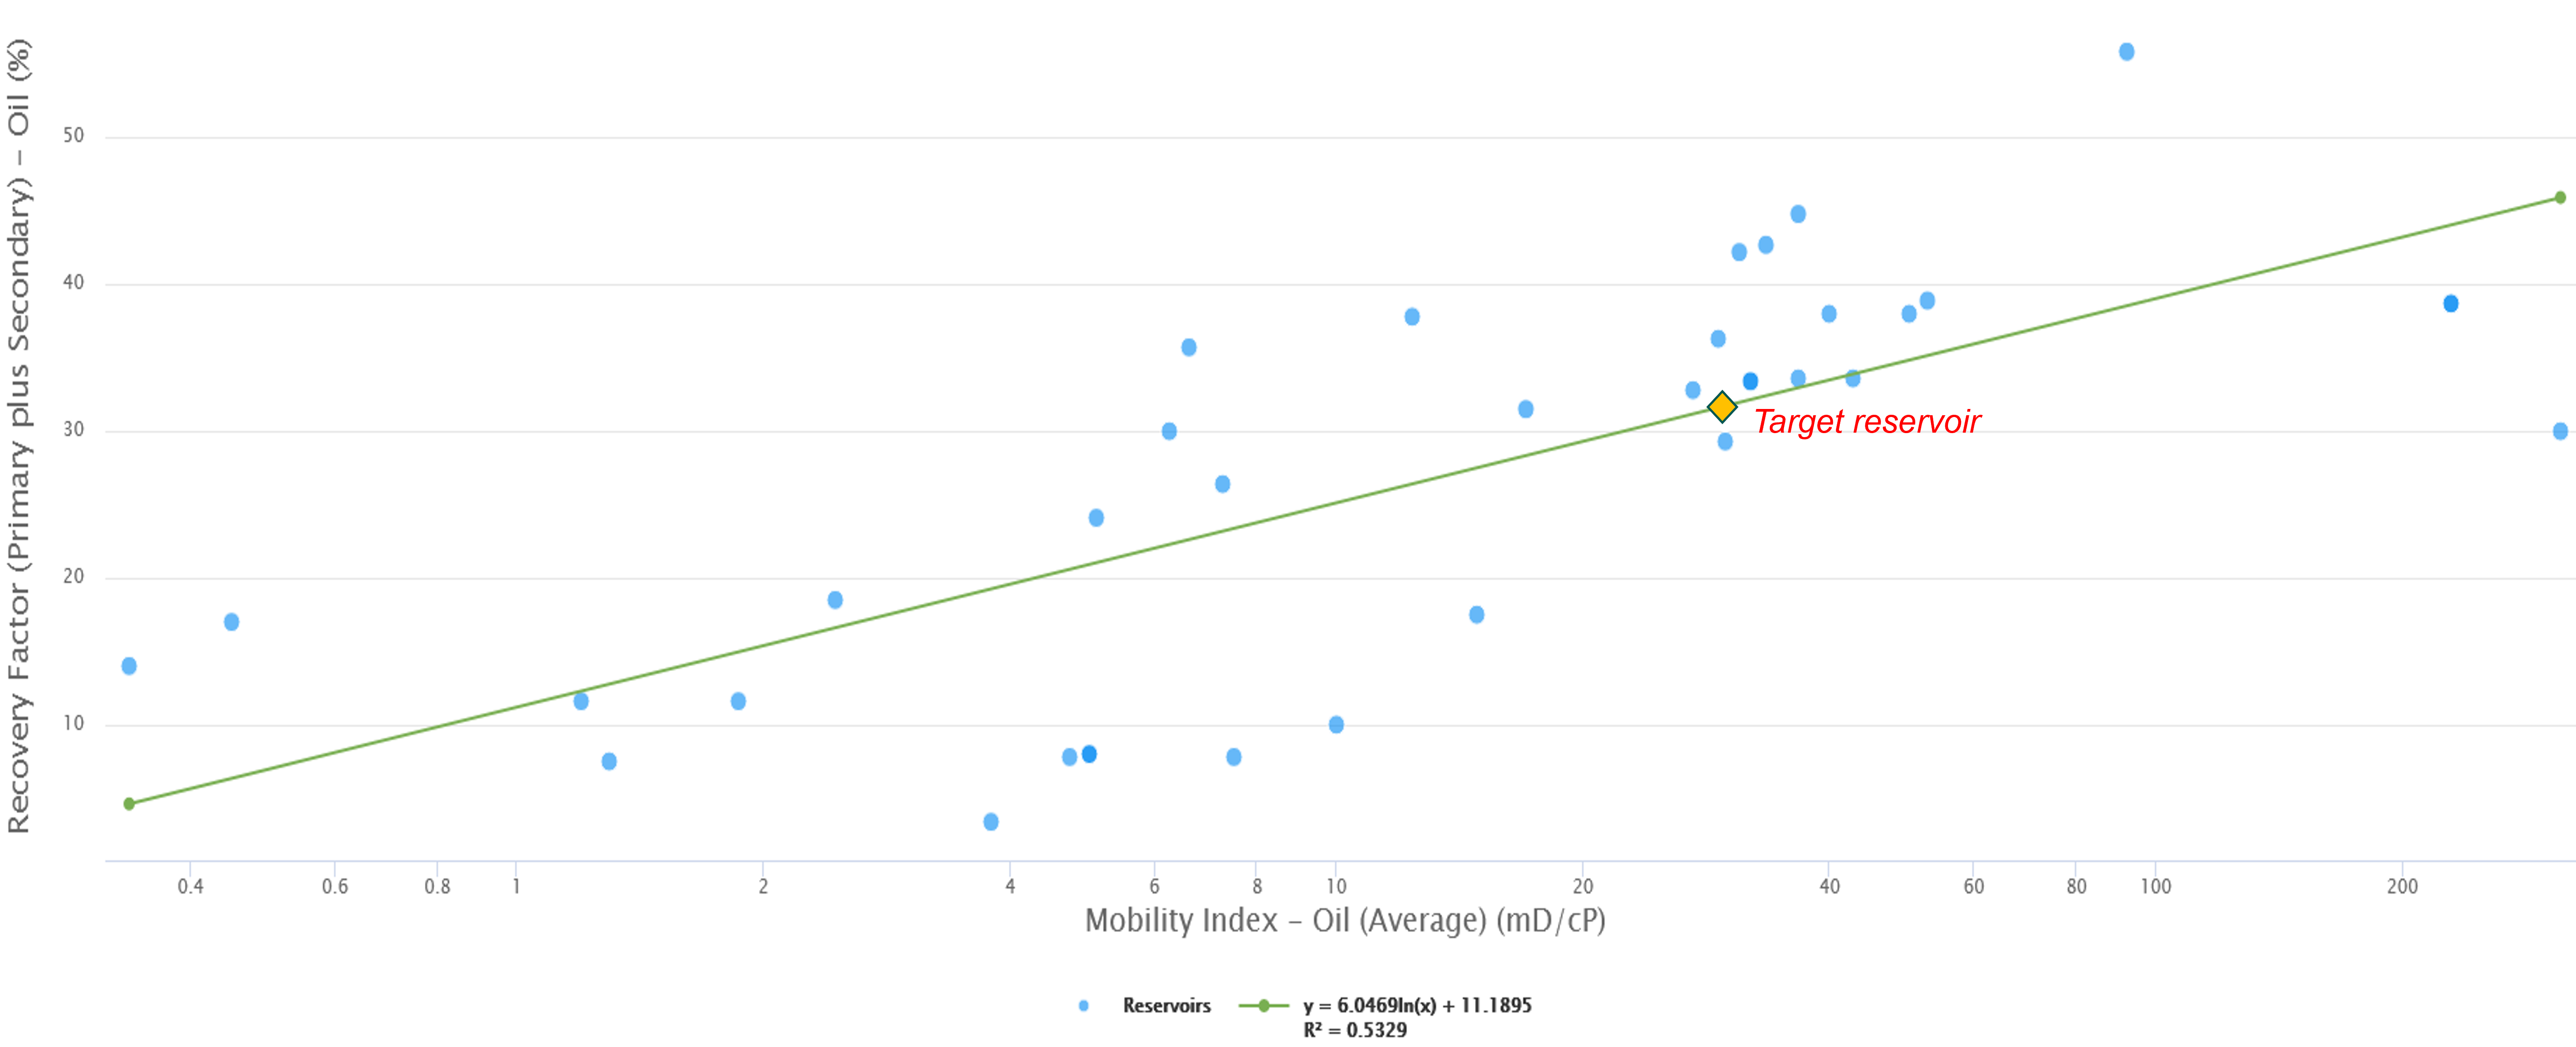
Fig. 2 – Expected recovery factor under waterflood for target reservoir when compared to 34 reservoirs.
Validate Viable EOR Methods
By widening the search criteria to onshore clastics, it is revealed that the target reservoir is too deep for thermal EOR and instead chemical flood is a more viable option in this situation (Fig. 3).
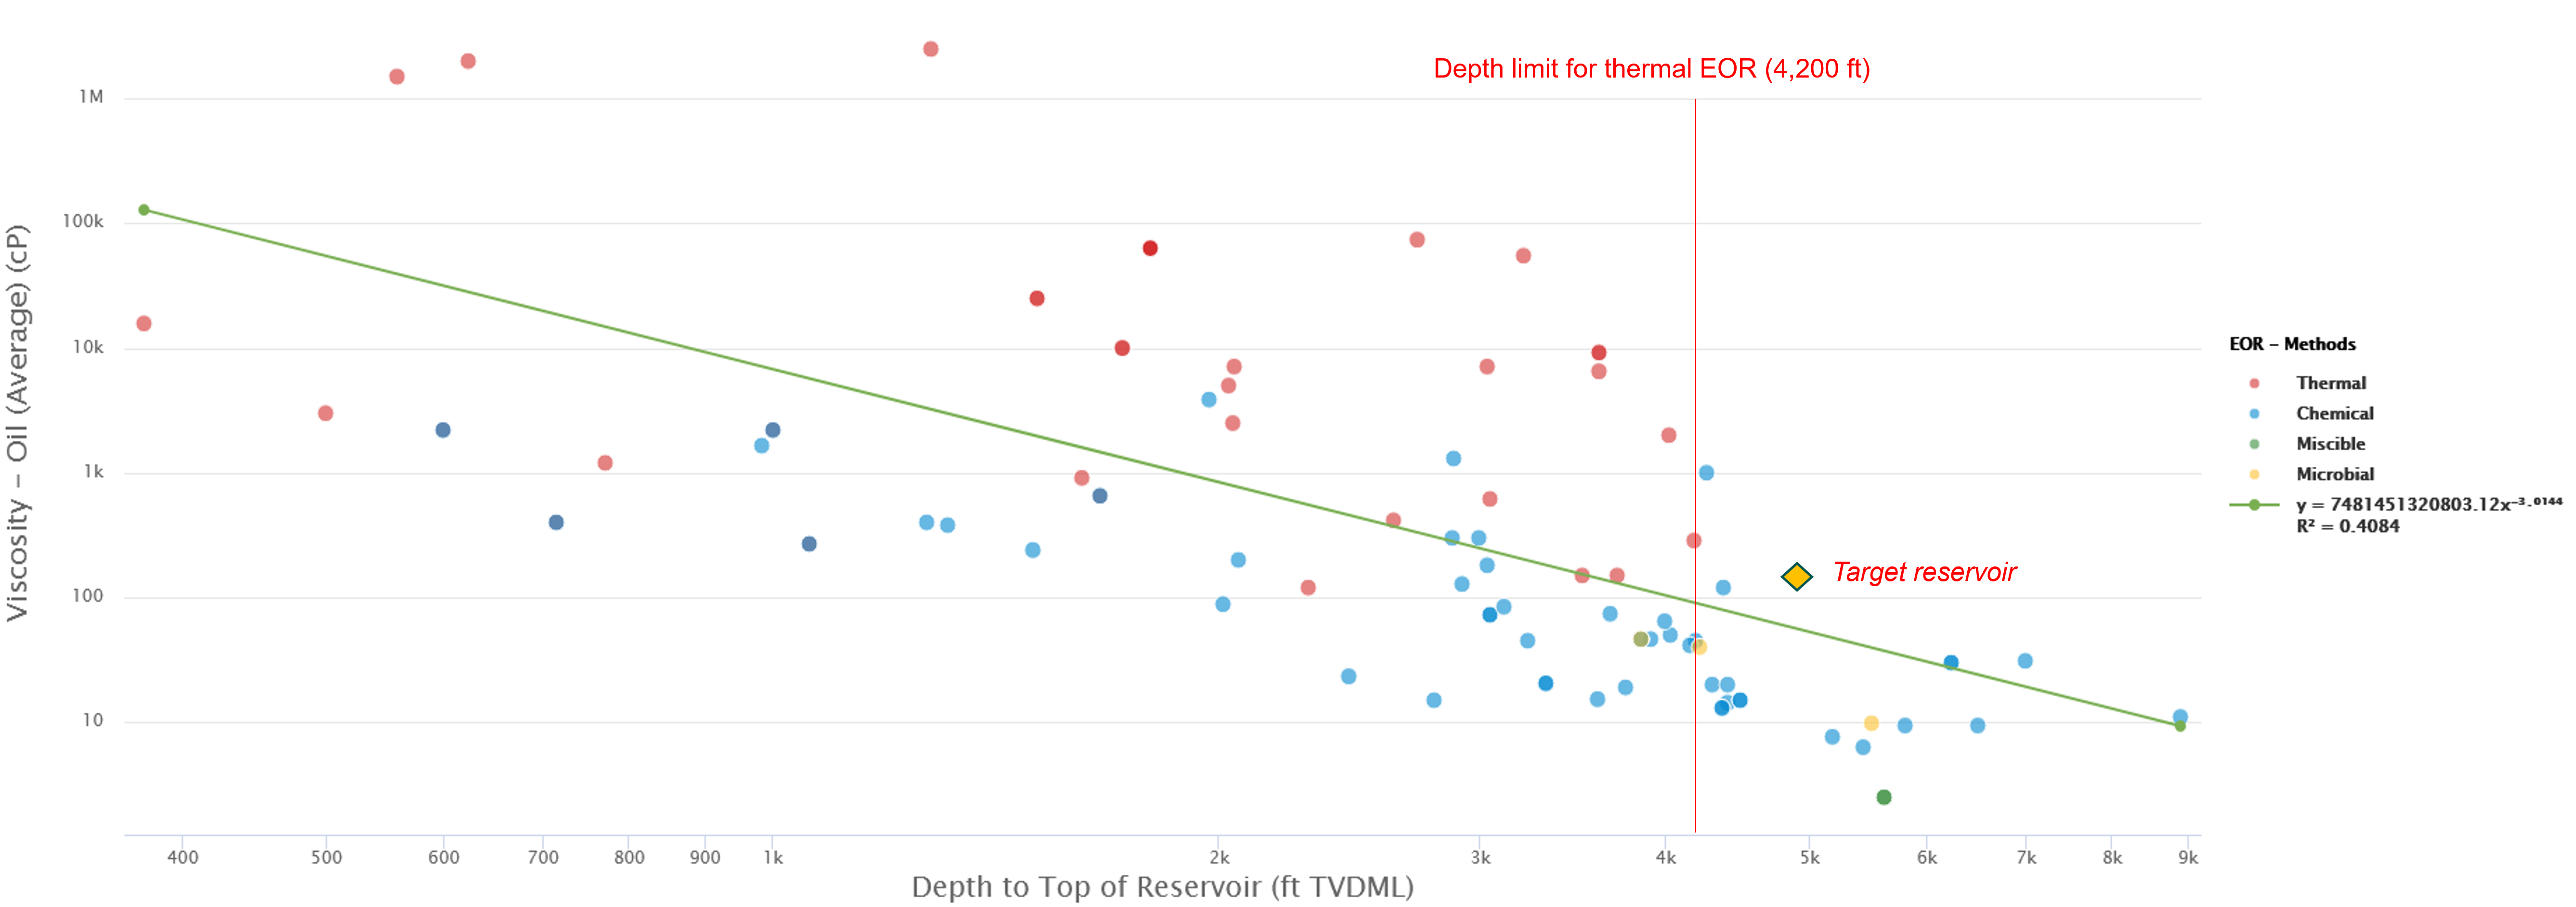
Fig. 3 – Crossplot highlighting EOR methods used in reservoirs based on viscosity and depth to top of reservoir.
Key Performance Indicator for Polymer Flood Analogues
The analogue search is now refined back to the original criteria (Table 1) and the target reservoir is benchmarked to discover key performance indicators for polymer flood. Benchmarking against relevant analogues reveals that:
- Pore volume Injected (PV) averages 0.32, ranging from 0.2 (P90) to 0.6 (P10) (Fig. 4a).
- Incremental recovery averages 8%, ranging from 4.4% (P90) to 12.4% (P10) (Fig. 4b).
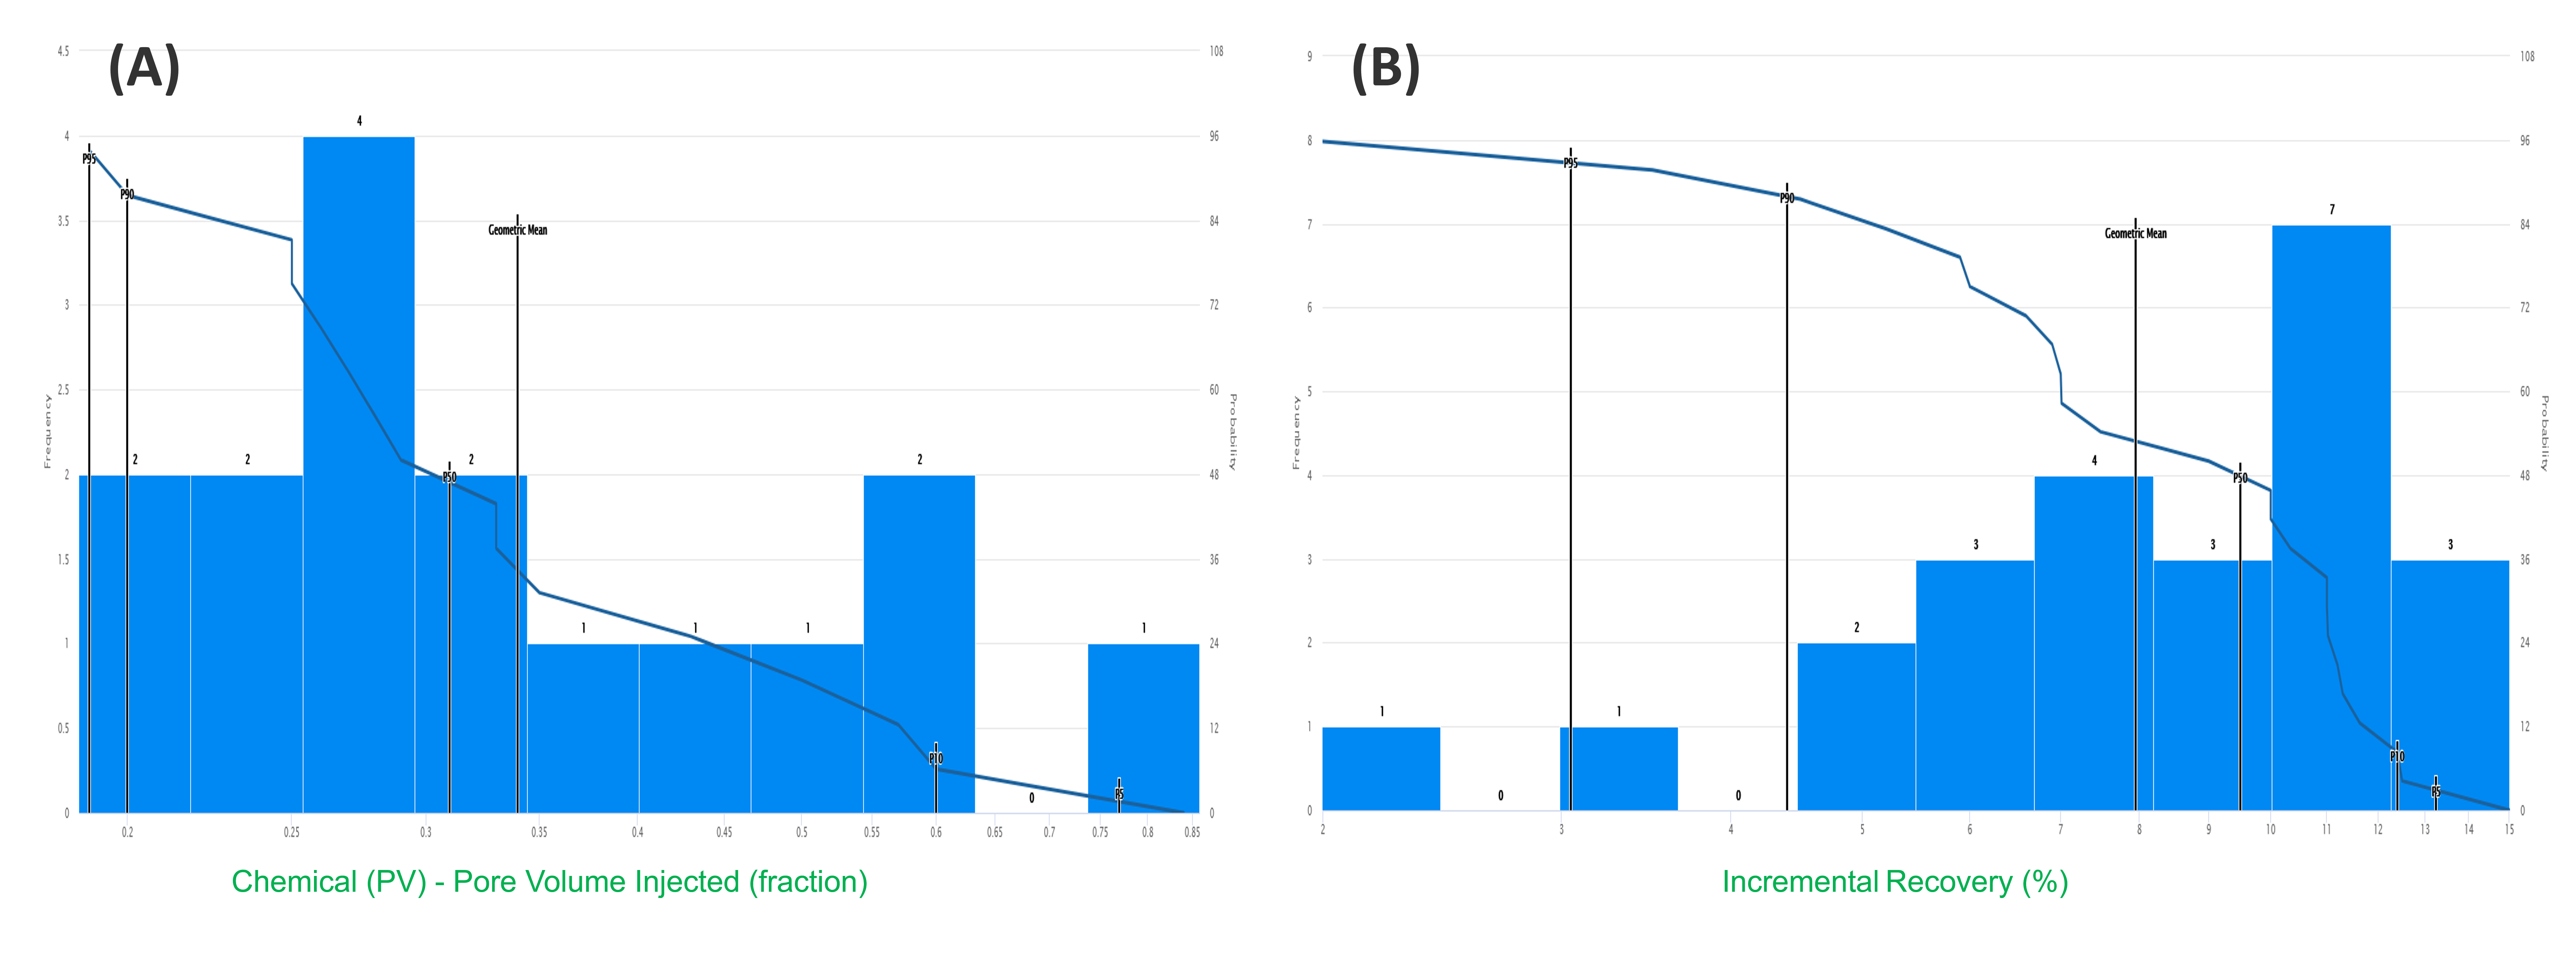
Fig. 4 – A) Chemical (PV) Pore volume injected (fraction), B) Incremental recovery (%).
Calibrate Ultimate Recovery Potential for Polymer Flood
Using an average chemical injected PV of 0.32, the target reservoir has an on-trend ultimate recovery factor of 42% (Fig. 5), however by using an average incremental recovery of 8%, the ultimate recovery factor is estimated at 39%.
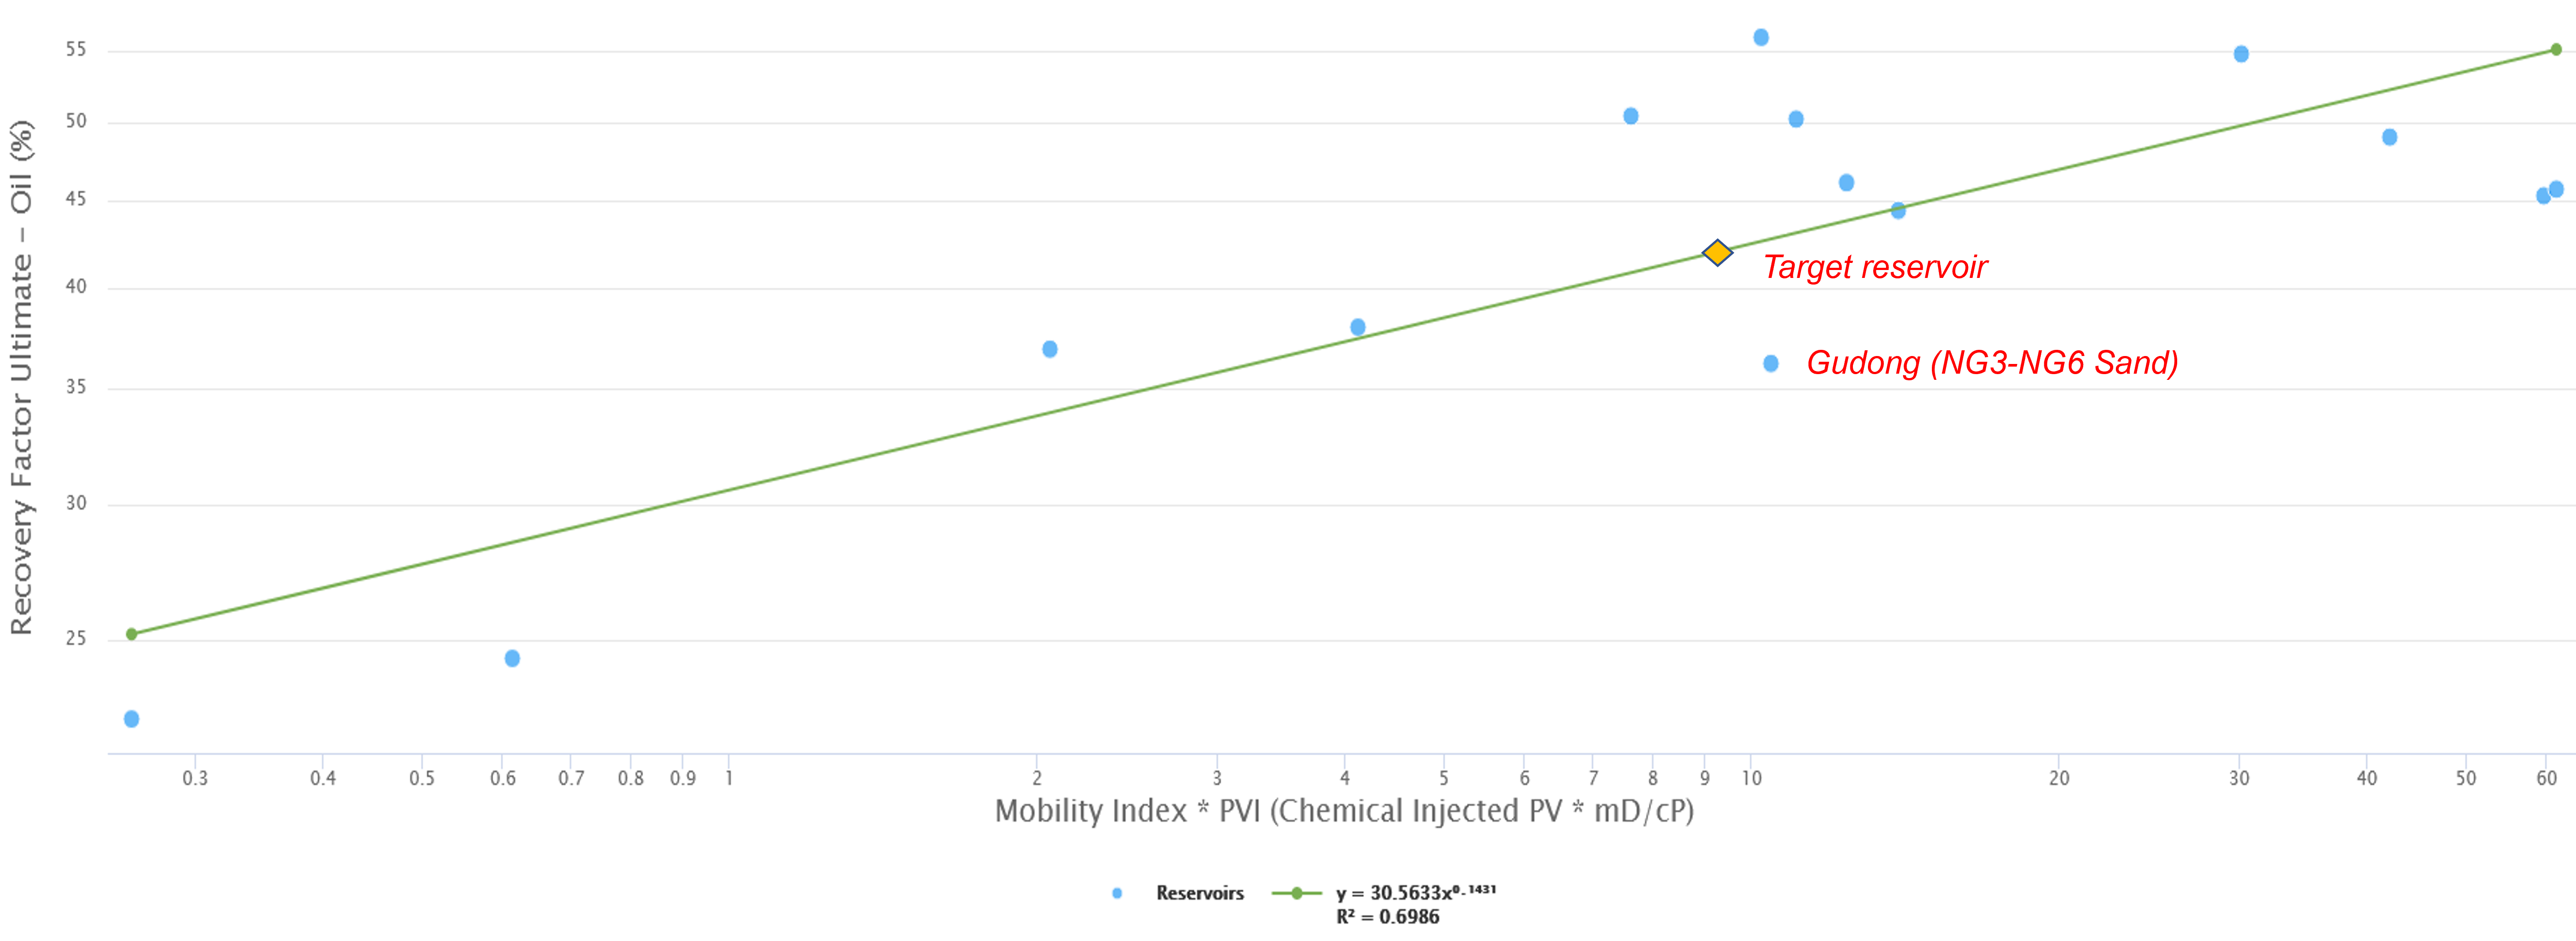
Fig. 5 – Calibrating ultimate recovery potential for polymer flood against 14 applicable global analogues.
Step 4: Identify Best Practices
Gudong NG3-NG6 Sand, Onshore China
The Gudong NG3-NG6 reservoir has comparable rock and fluid properties and waterflood recovery efficiency to the target reservoir, including:
- Fluvial sandstones with a matrix porosity of 34% and air permeability of 1927 mD
- Heavy oil with 17 °API gravity, viscosity of 65 cP and mobility index of 30 mD/cP
- Recovery efficiency under waterflood: 29%
- Polymer flood incremental recovery: 7%
- Injectant utilization: 1.83 kg/BO
- Ultimate recovery factor: 36%
- Upside incremental recovery potential by surfactant-polymer (SP) flood: 9.7%
- Reservoir management: profile modification, water-plugging, shut-in of high water-cut wells, injection rate optimization, workover and infill drilling
Polymer Flood Performance
In the case of the Gudong NG3-NG6 reservoir, the oil production rate was inversely proportional to water-cut. Throughout its production history, the maximum water-cut drop during polymer flood was 15%.
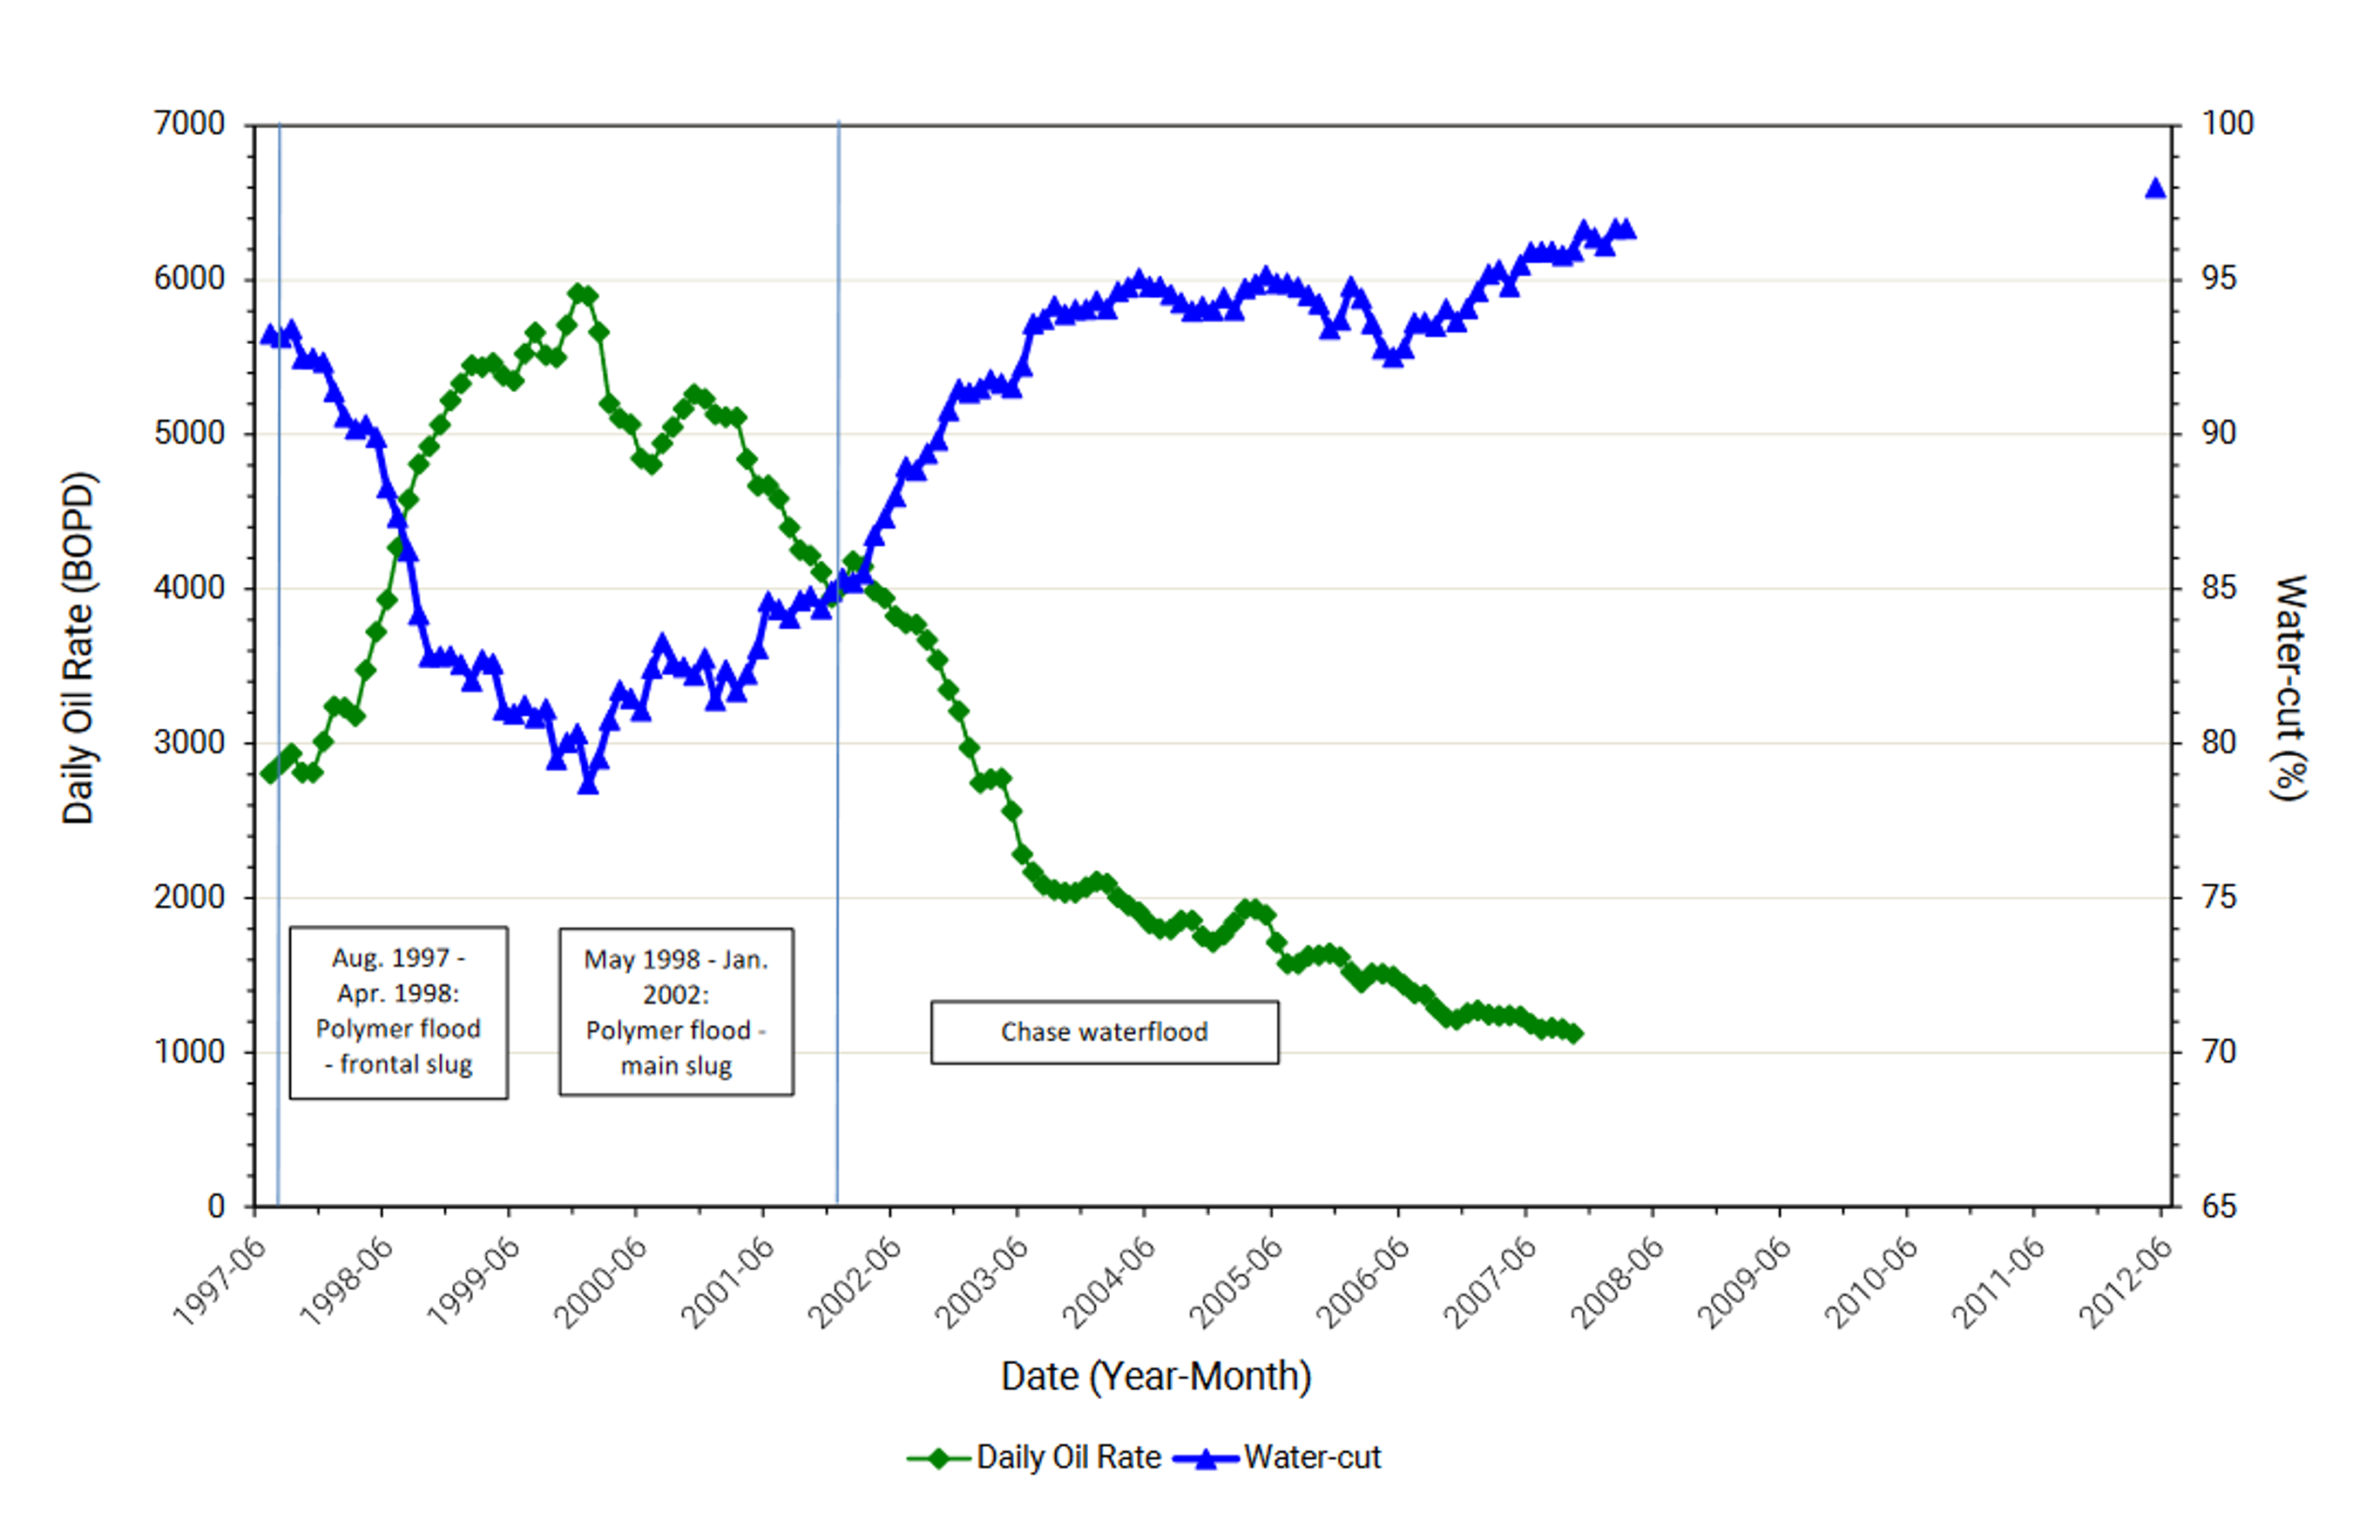
Fig. 6 – Daily oil rate (BOPD) over time for Gudong NG3-NG6 reservoir, onshore China.
Incremental Recovery Trend for Polymer Flood
Benchmarking incremental recovery using polymer flood against injectant utilization shows that the Gudong NG3-NG6 reservoir lies below the analogue incremental recovery trend, indicating suboptimal injectant utilization (Fig. 7).
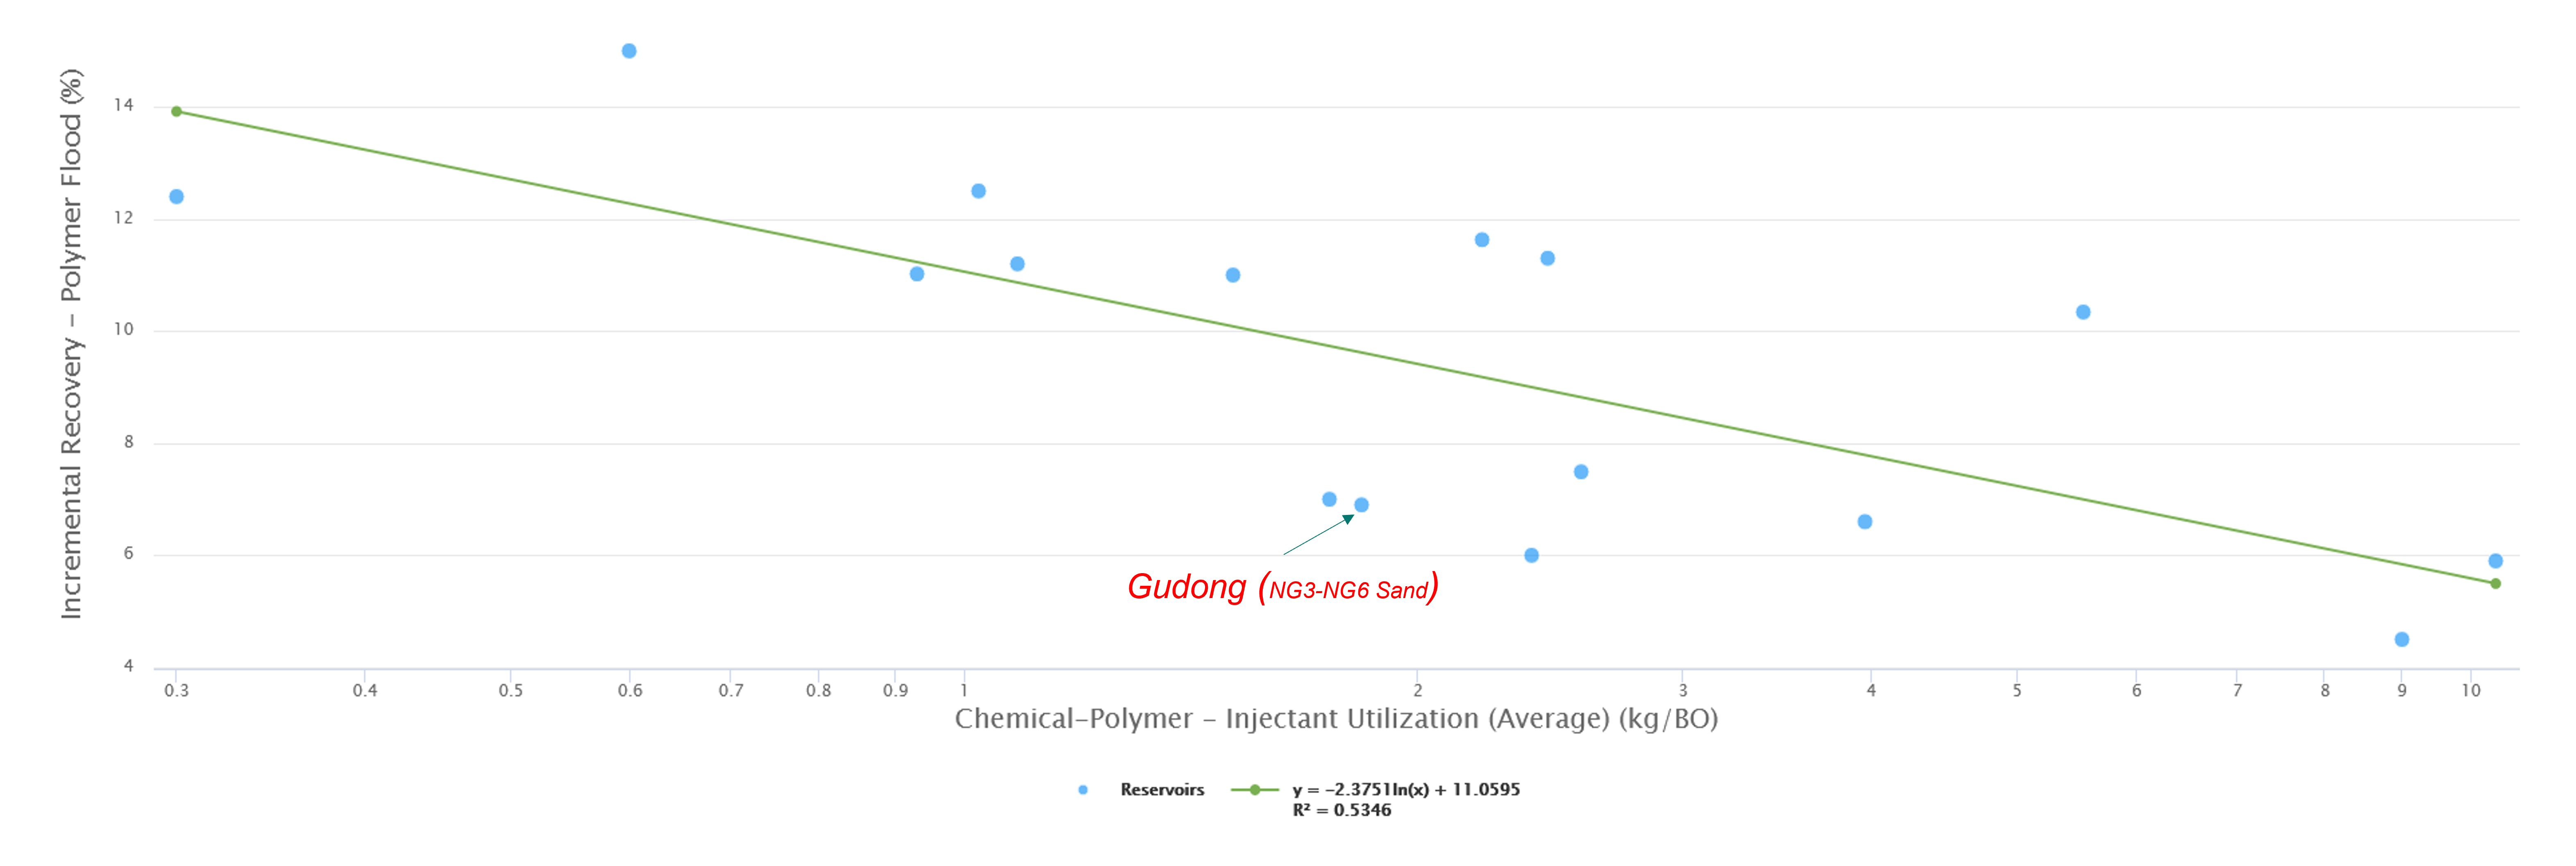
Fig. 7 – Establishing incremental recovery trend line for Gudong NG3-NG6 reservoir against 16 applicable global analogues.
Conclusions
Based on insights derived from analogue benchmarking the following conclusions can be drawn.
- Target reservoir is too deep for thermal EOR – chemical flood is a more viable option
- Estimated recovery efficiency under waterflood is on trend with analogues
- Estimated ultimate recovery factor ranges from 39% (using average polymer flood incremental recovery: 8%) to 42% (using average chemical injected PV: 0.32)
- Success of the Gudong NG3-NG6 EOR project proved the applicability of polymer flood in viscous oil reservoirs at commercial scale
- Significant upside recovery potential for the Gudong NG3-NG6 reservoir by surfactant-polymer (SP) flood and improved injectant utilization
- Analogue benchmarking gives confidence in the estimation of ultimate recoverable reserves
