Benchmarking and analysis of oil & gas assets just got easier.
C&C Reservoirs is excited to introduce several new additions to the Digital Analogue Knowledge System (DAKS). Aimed to improve overall user experience and functionality, these new features will help facilitate simple, repeatable analysis and benchmarking of global E&P assets.
New Multi-Chart View
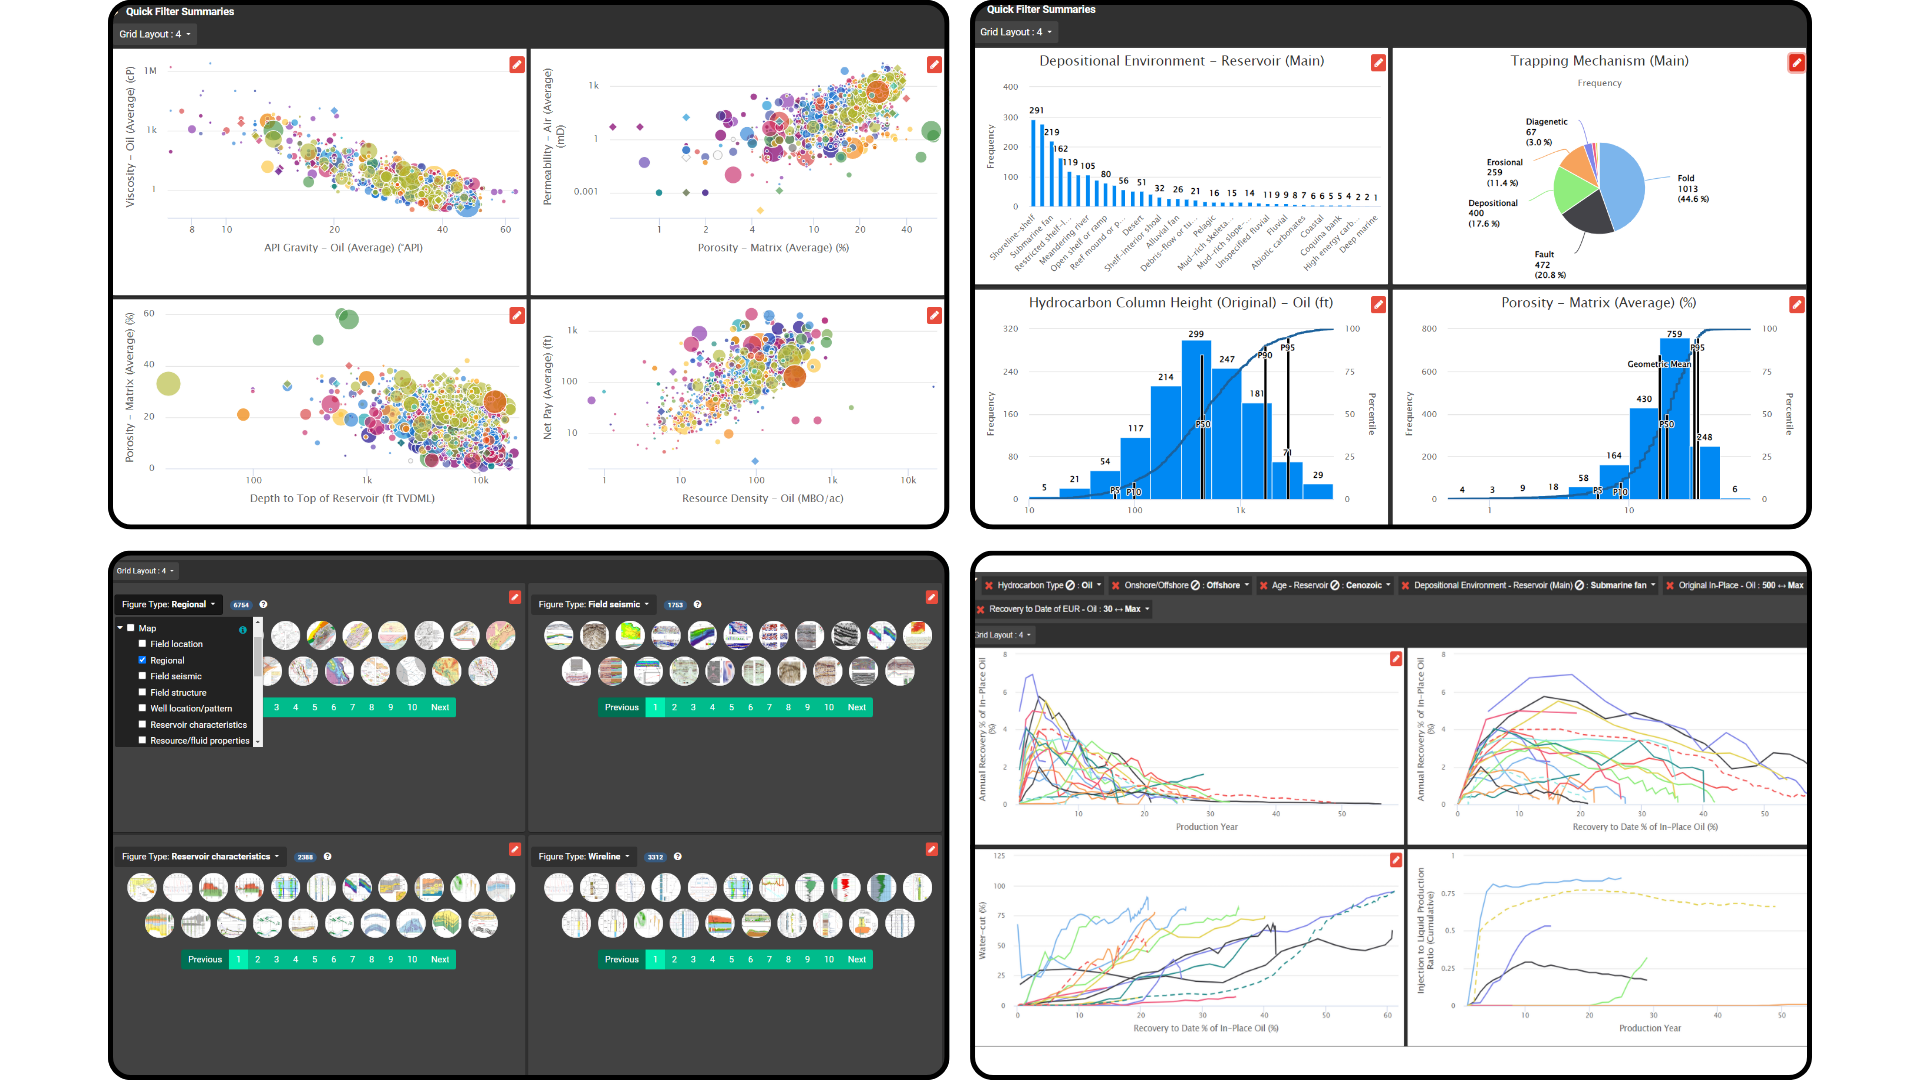
View up to 6 windows side by side, including all benchmarking and analytical tools found in DAKS (excluding Empirical Recovery Tool). Simply open any tool and click the new ‘Multiple View’ button to simultaneously compare crossplots, figures, parameter distributions, and reservoir performance curves. Identify key performance metrics and previously missed correlations, and draw out details for greater analysis with simple, holistic representations of reservoirs.

New ‘Benchmark Targets’ Feature
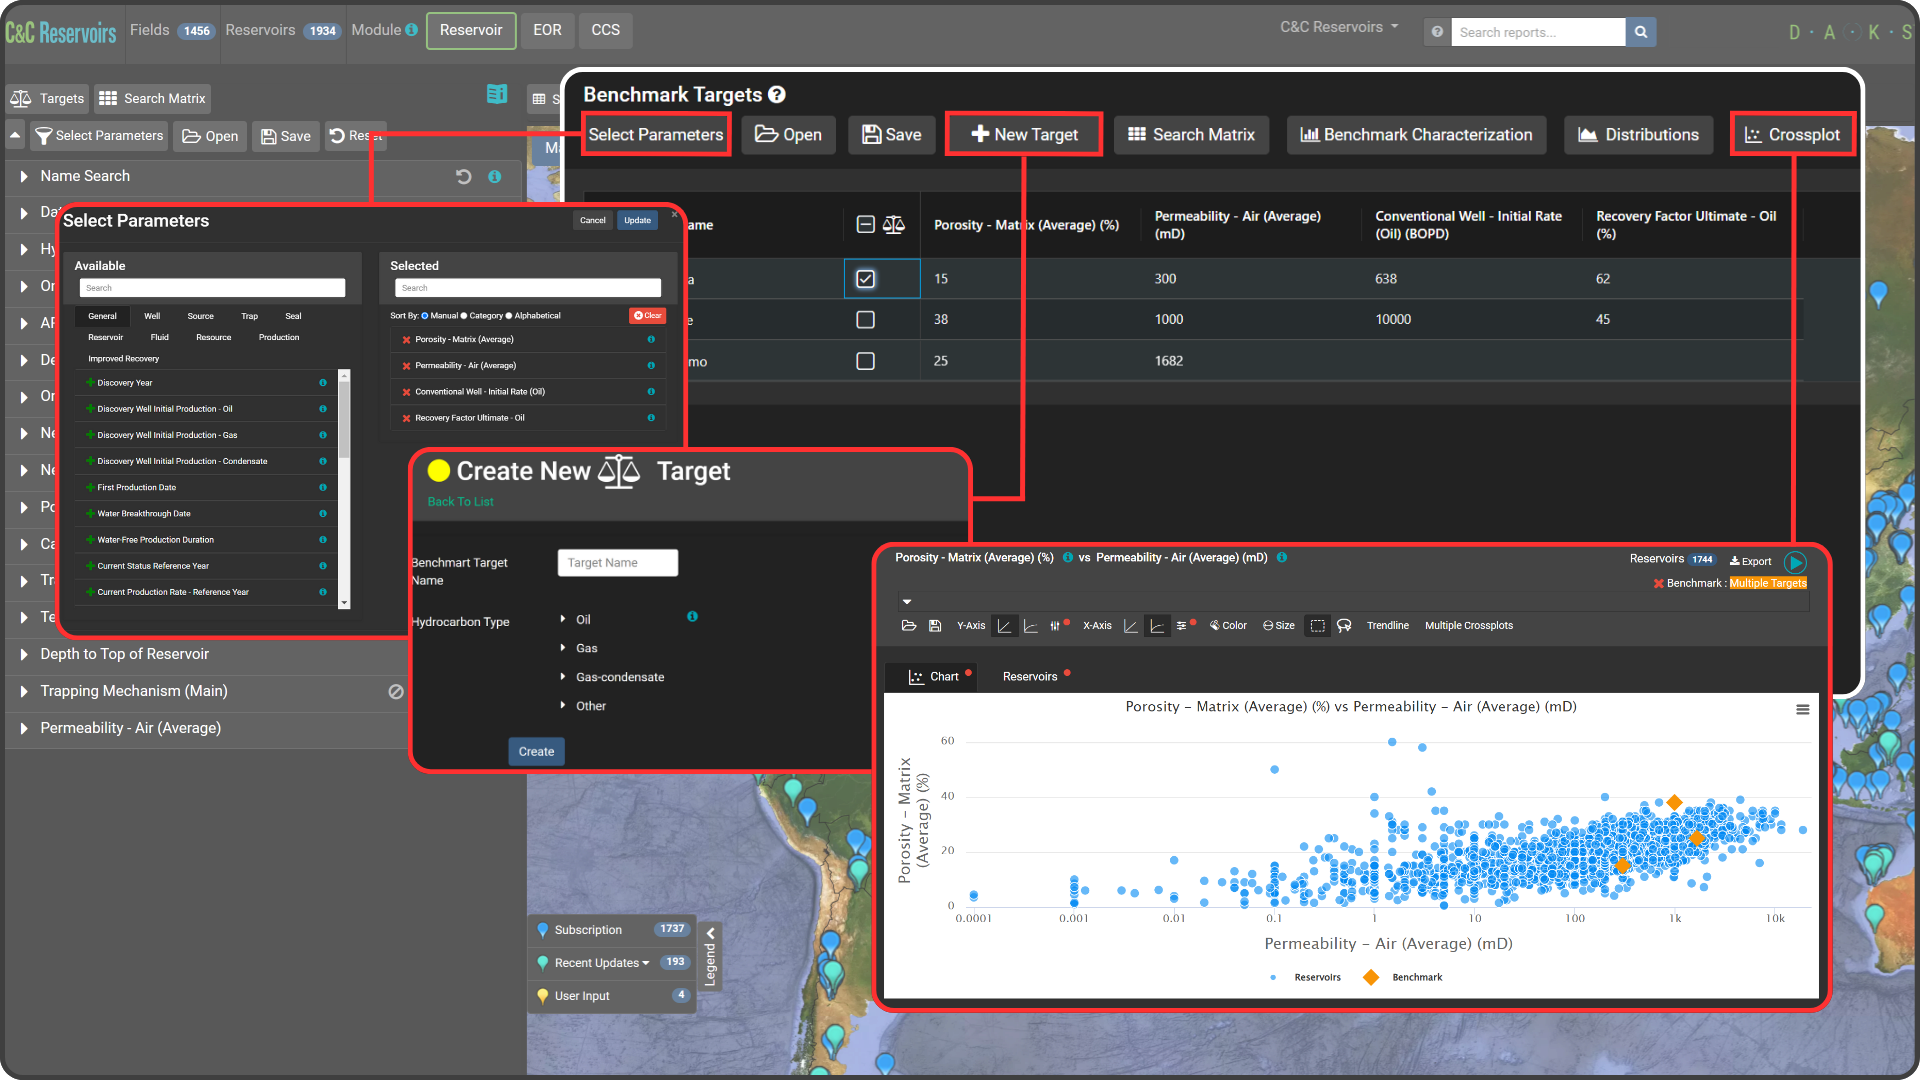
Enabling a more streamlined proprietary benchmarking experience, the new ‘Benchmark Target’ feature allows users to quickly input, and benchmark, different reservoir parameter values and scenarios. In addition to the Input Tool, DAKS users can now easily benchmark individual target values without having to create an entire proprietary data pin. Users can now conveniently create a target and select any number of numerical parameters to benchmark and test project scenarios.

New Analogue Search Matrix
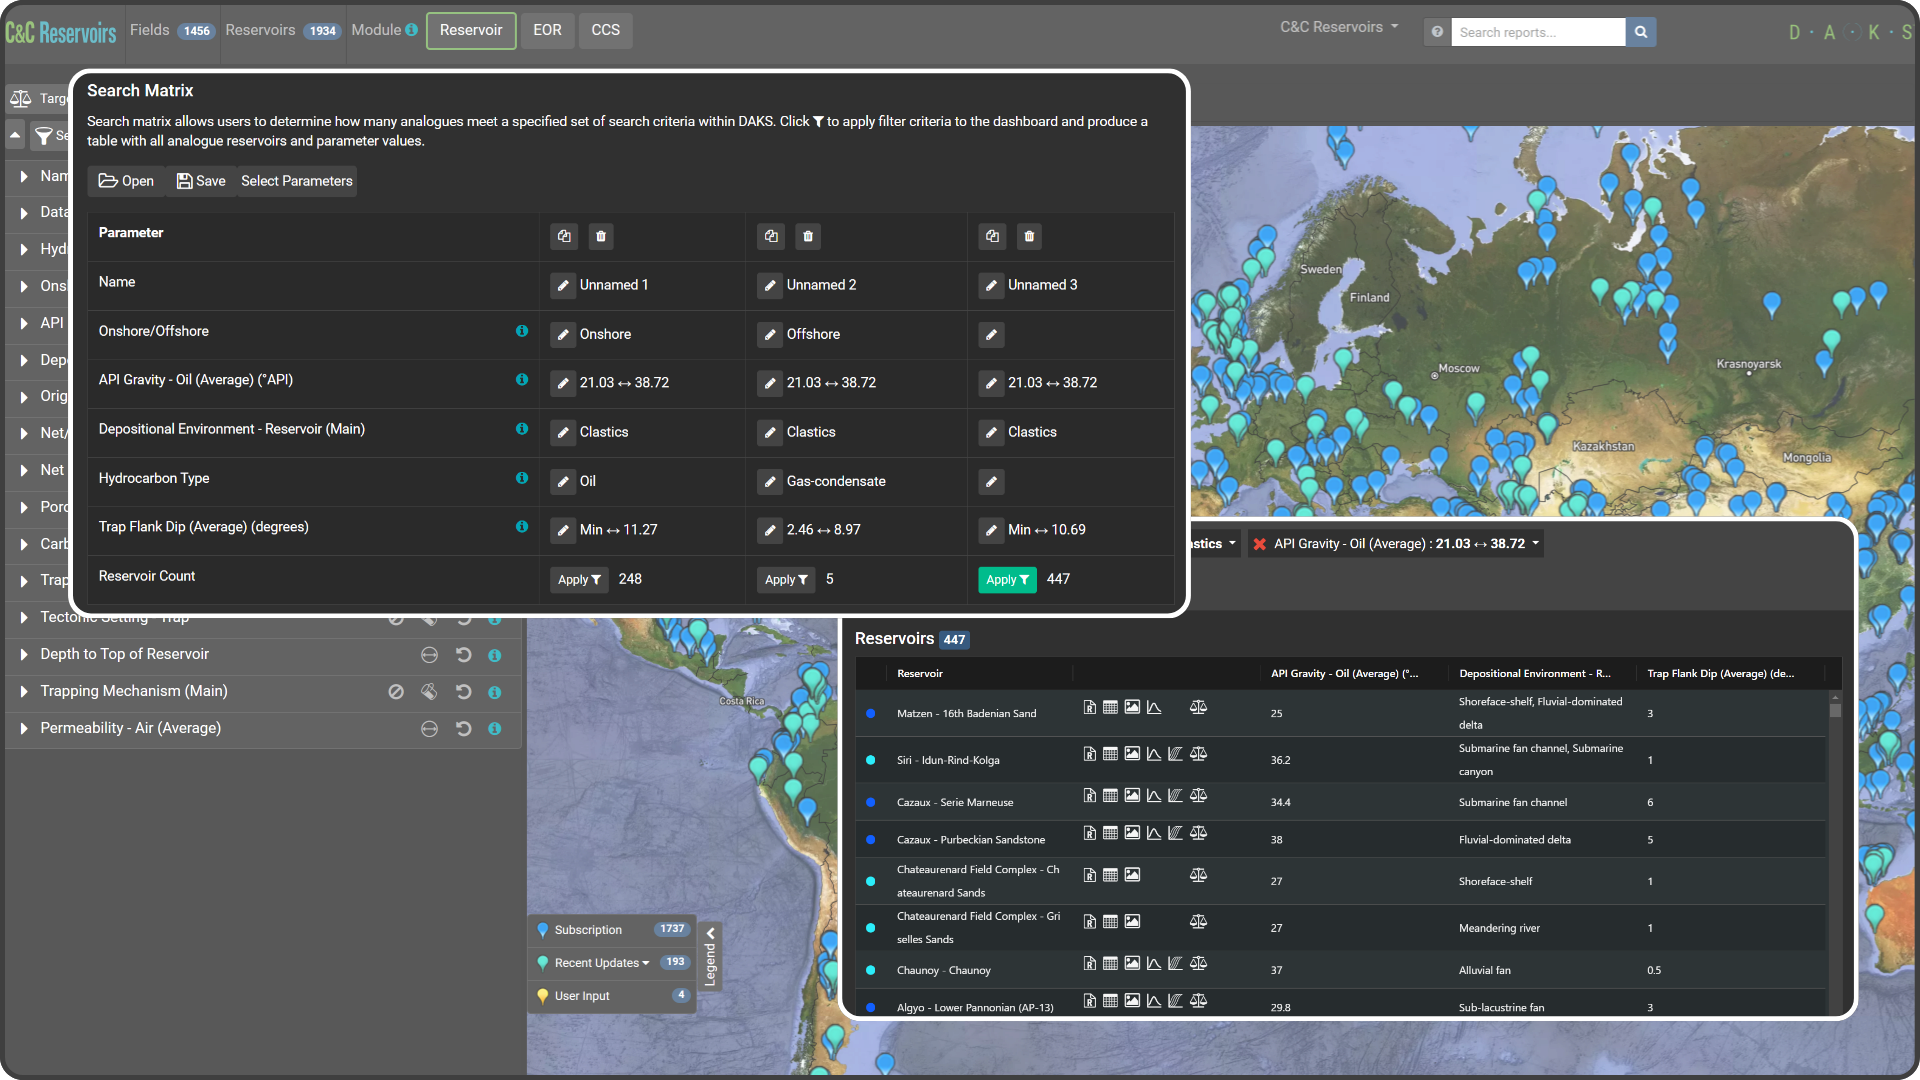
The new DAKS Analogue Search Matrix allows users to assess analogue sets for different search scenarios without the need to clear and re-enter search criteria. Use this feature to identify parameter values controlling analogue distributions and compare different sets of analogues for various scenarios throughout the life of a project.

New Tool Bar
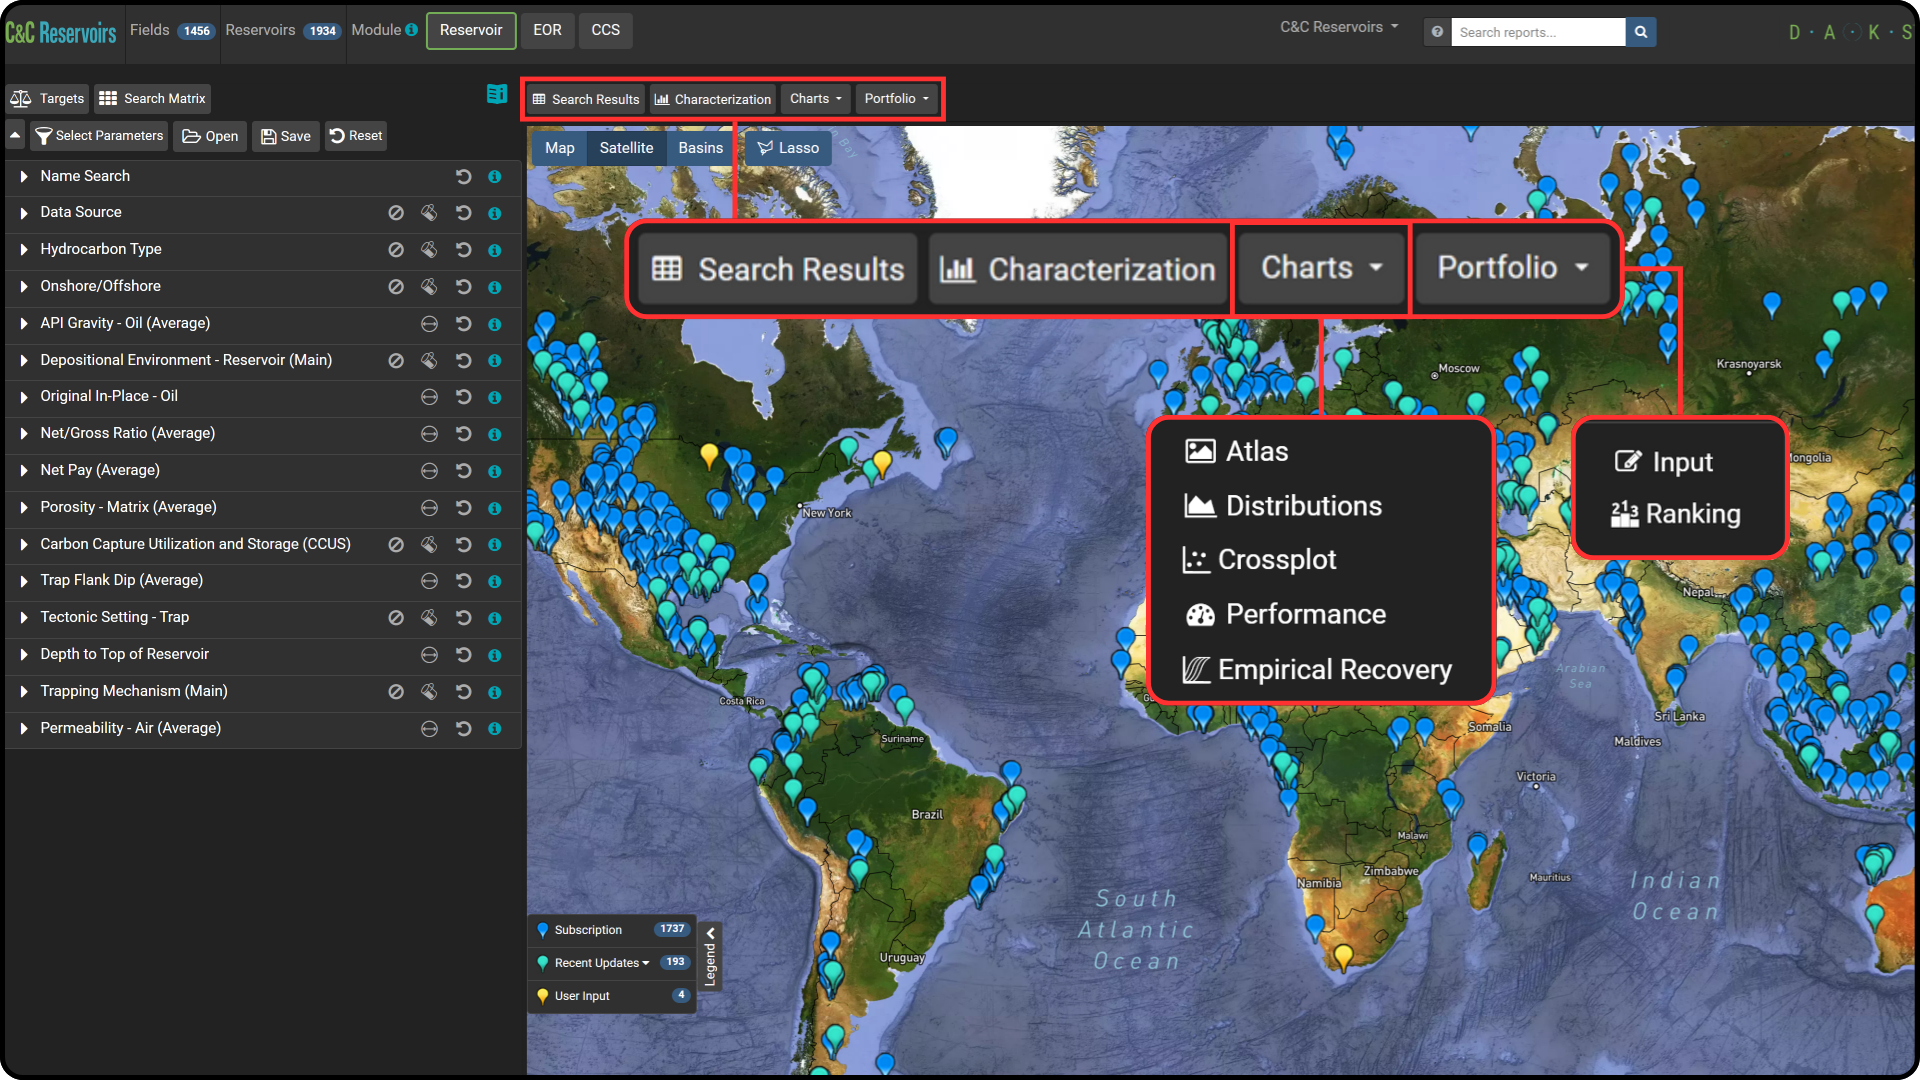
The DAKS tool bar has now been relocated to a bar above the main map window and consolidated. Buttons for “Search Results”, and “Characterization” can be seen here along with dropdown buttons for “Charts”, and “Portfolio”.
Charts – Houses all tools associated with charts in DAKS (Atlas, Distributions, Crossplot, Performance, and Empirical Recovery). The Distributions Tool allows users to directly open histograms, and bar charts for reservoir parameters within DAKS.
Portfolio – Users can access the classic “Input Tool” or “Ranking Tool” (formerly Portfolio Tool) for comparison of users’ proprietary reservoir yellow pins with global analogues.

