Introduction
This study uses minimal prior information to place into context the exploration potential for two prospects that lack well information in the Pelotas and Punta del Este Basins, offshore Uruguay. Prospect A is representative of a typical prospect within the Cretaceous turbidite play (Fig. 1). It is interpreted to be charged by marine Aptian shales, with an Albian sandstone reservoir sealed by Cenomanian shales during regional transgression, trapped in a structural-stratigraphic trap. Prospect B is representative of a typical Cretaceous shallow-marine sandstone play (Fig. 2). It is charged by Barremian lacustrine shales into Maastrichtian reservoirs, and sealed by transgressive Paleocene shales, in stratigraphic pinch-outs and/or sub-unconformity truncation traps.
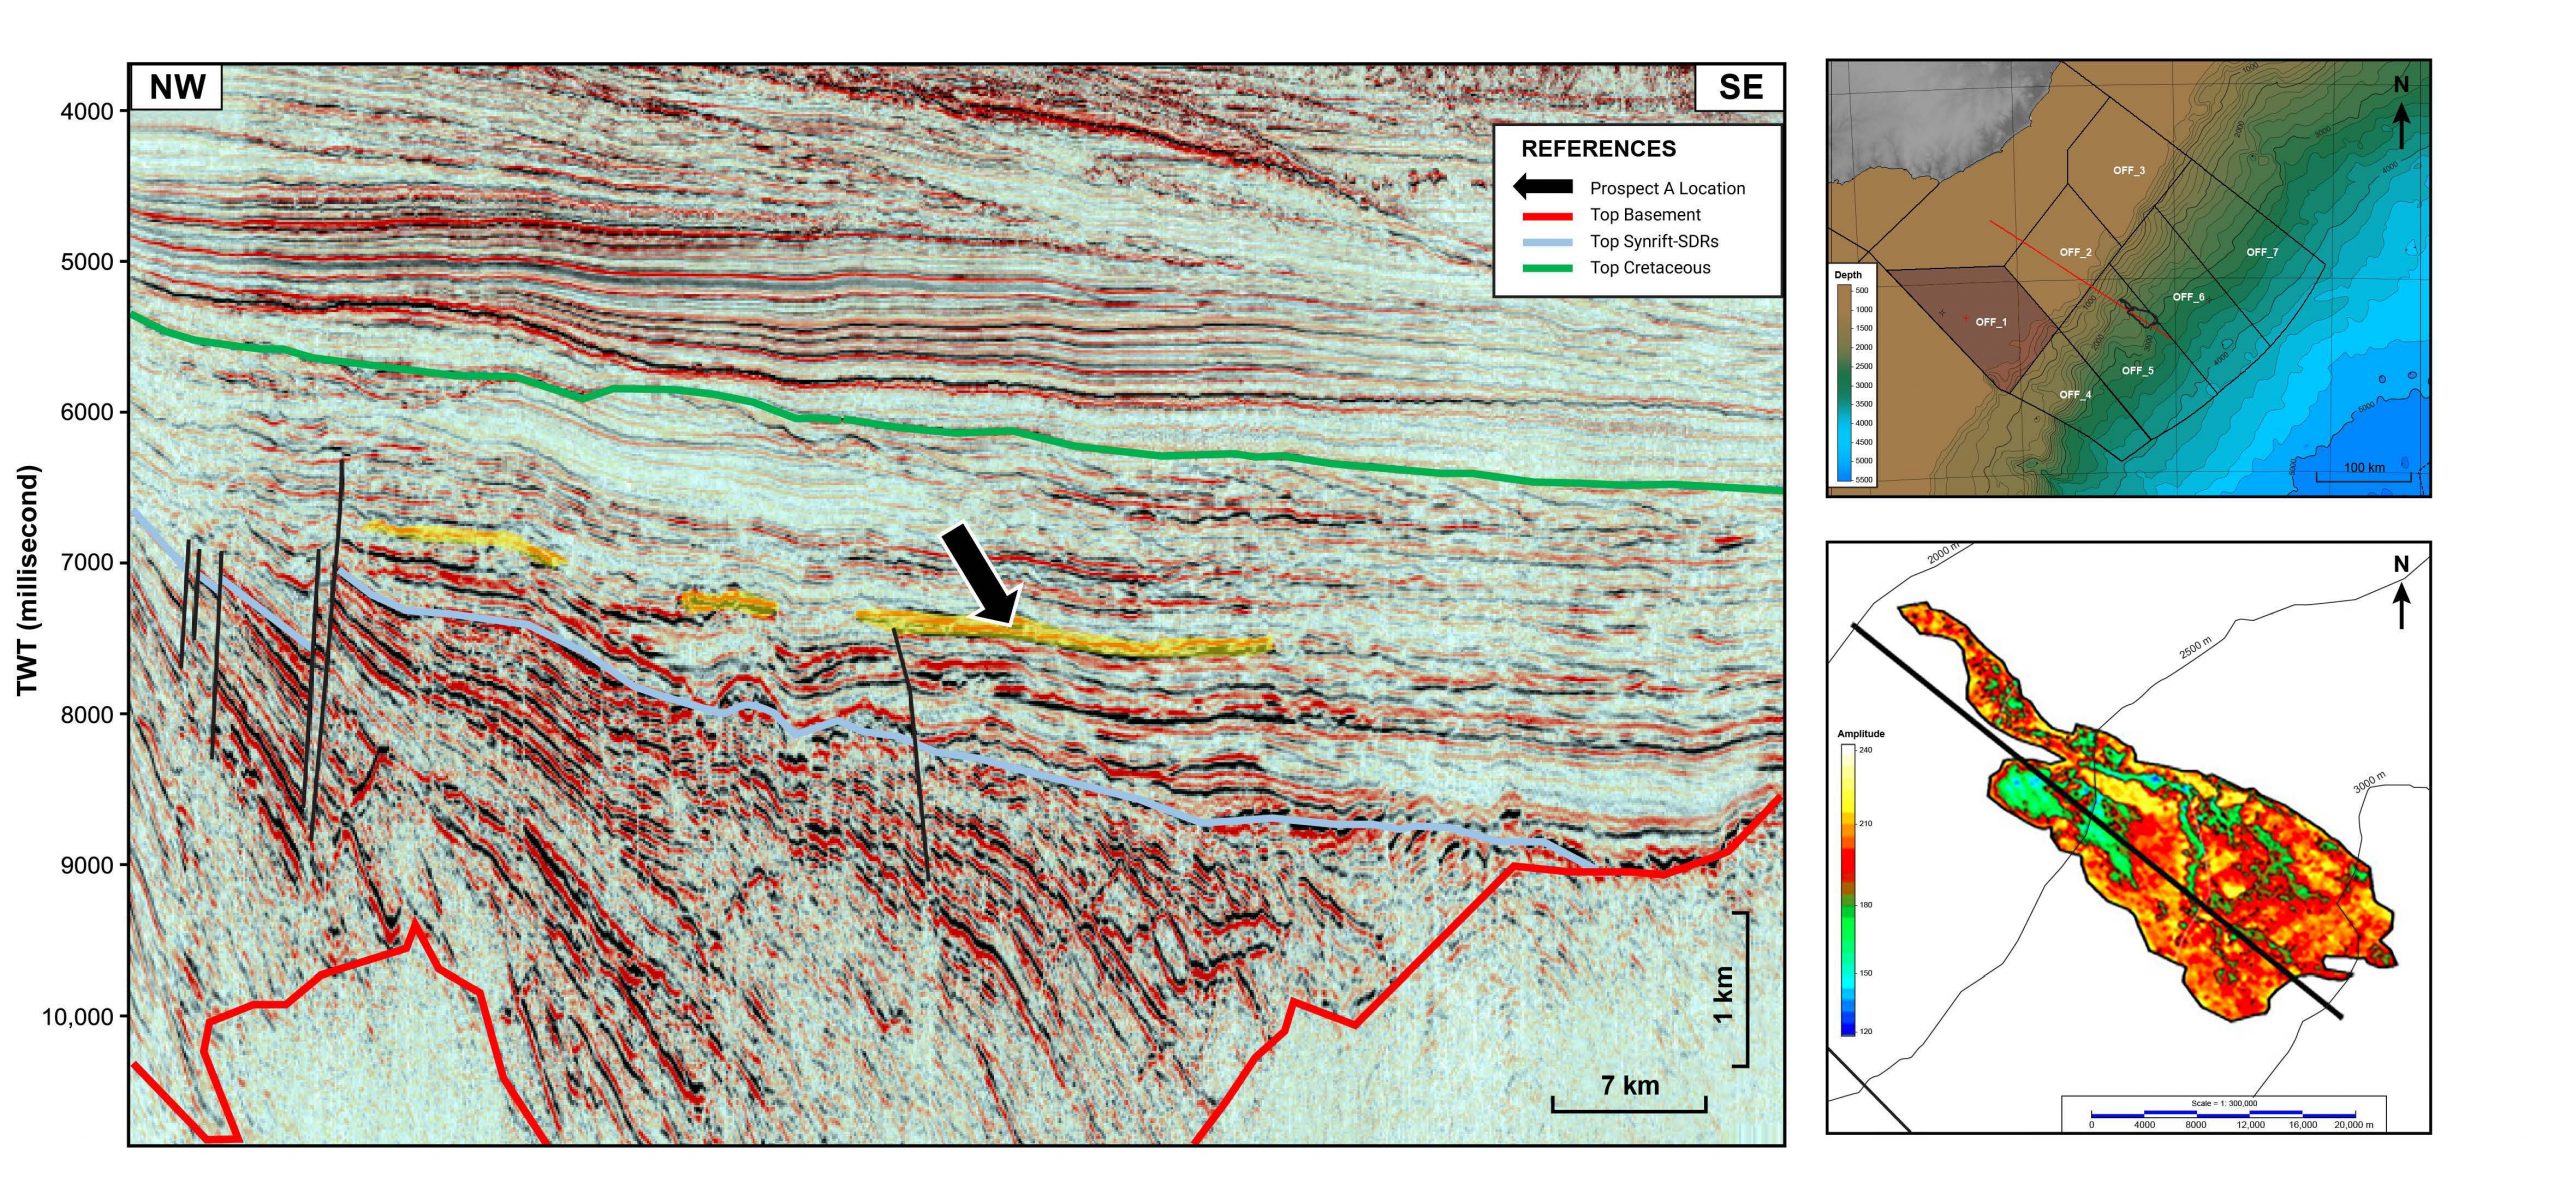
Fig. 1 – Northwest-southeast dip seismic line across Prospect A showing geometry of the mapped stratigraphic pinch-out trap. Inset maps show study area and prospect outline. Seismic polarity is SEG standard.
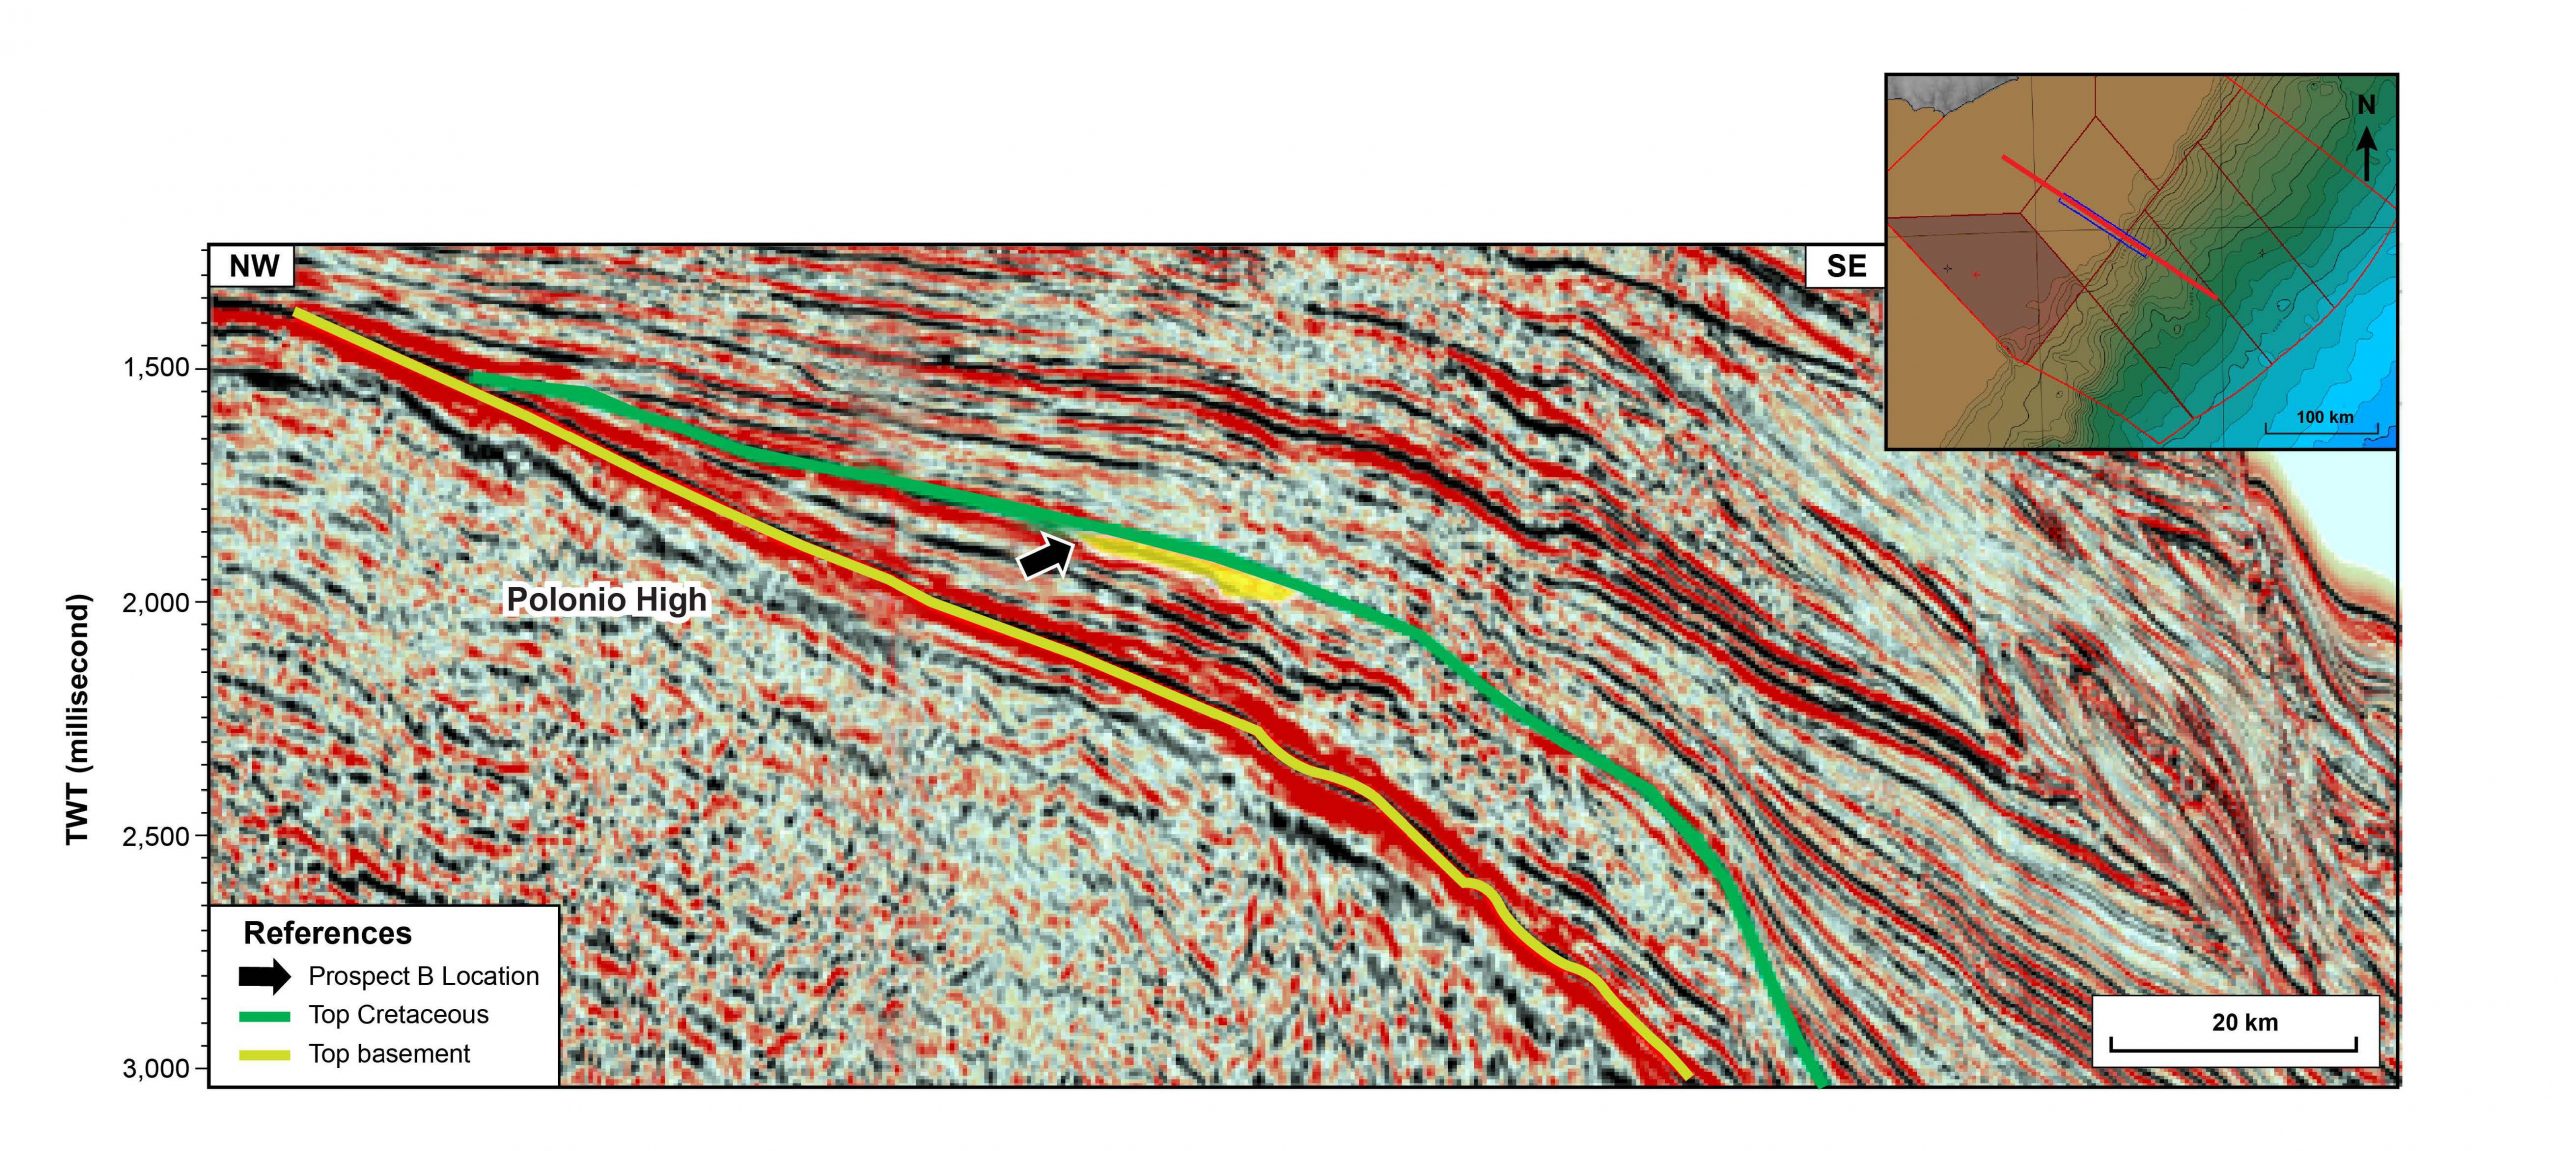
Fig. 2 – Northwest-southeast dip seismic line across Prospect B showing geometry of the mapped sub-unconformity truncation trap. Inset map shows study area and prospect location. Seismic polarity is SEG standard.
C&C Reservoirs Analogue Benchmarking Workflow
The C&C Reservoirs Analogue Benchmarking Workflow (Fig. 3) was used to review the two prospects and to benchmark technical predictions, with the aim of placing previous work that describes the hydrocarbon potential of offshore Uruguay in the context of similar prospects and plays worldwide.
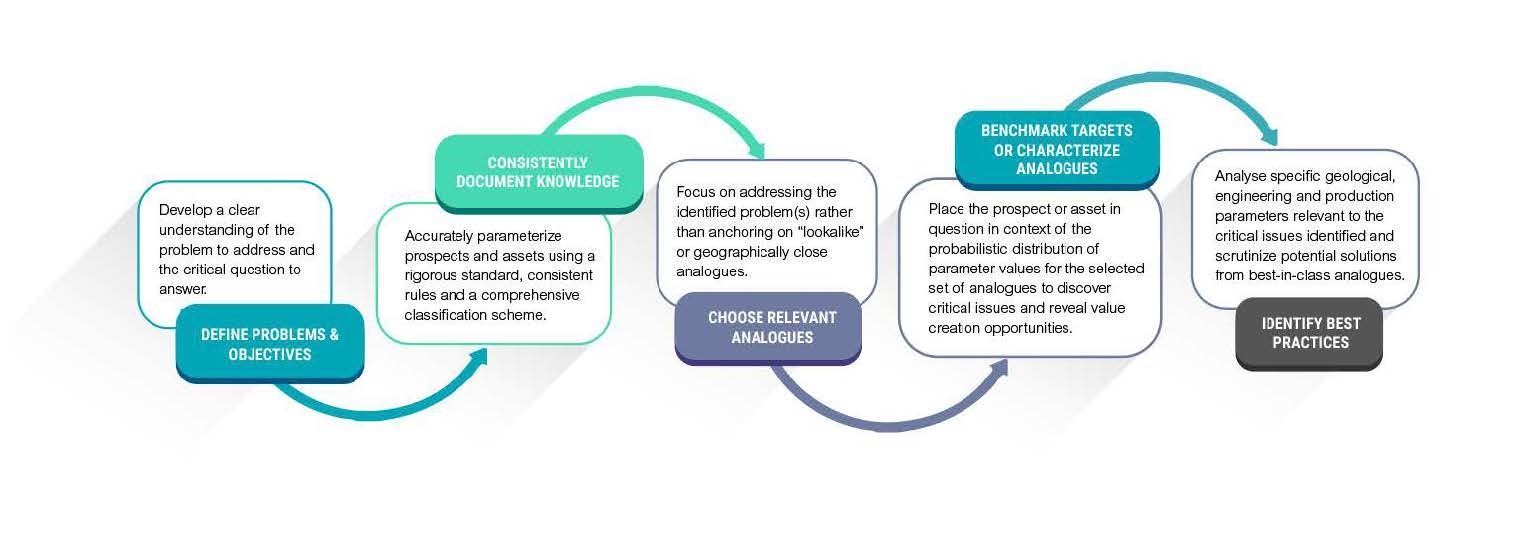
Fig. 3 – Flow chart illustrating key steps in the C&C Reservoirs Analogue Benchmarking Workflow and summarizing the requirements at each step.
Defining Problems and Objectives
The key questions that can be asked for prospects A and B using analogue intelligence are:
- What is the likely parameter distribution and uncertainty of Prospect A and Prospect B?
- What is the potential of the identified prospect based on similar global analogues?
Consistently Document Knowledge
Based on primary data provided by ANCAP, both text and numeric parameters have been standardised and classified using the consistent rules defined by C&C Reservoirs’ comprehensive classification scheme (Table 1). This standardisation ensures that accurate comparisons can be drawn from directly comparable analogues contained within the DAKS™ knowledge base.
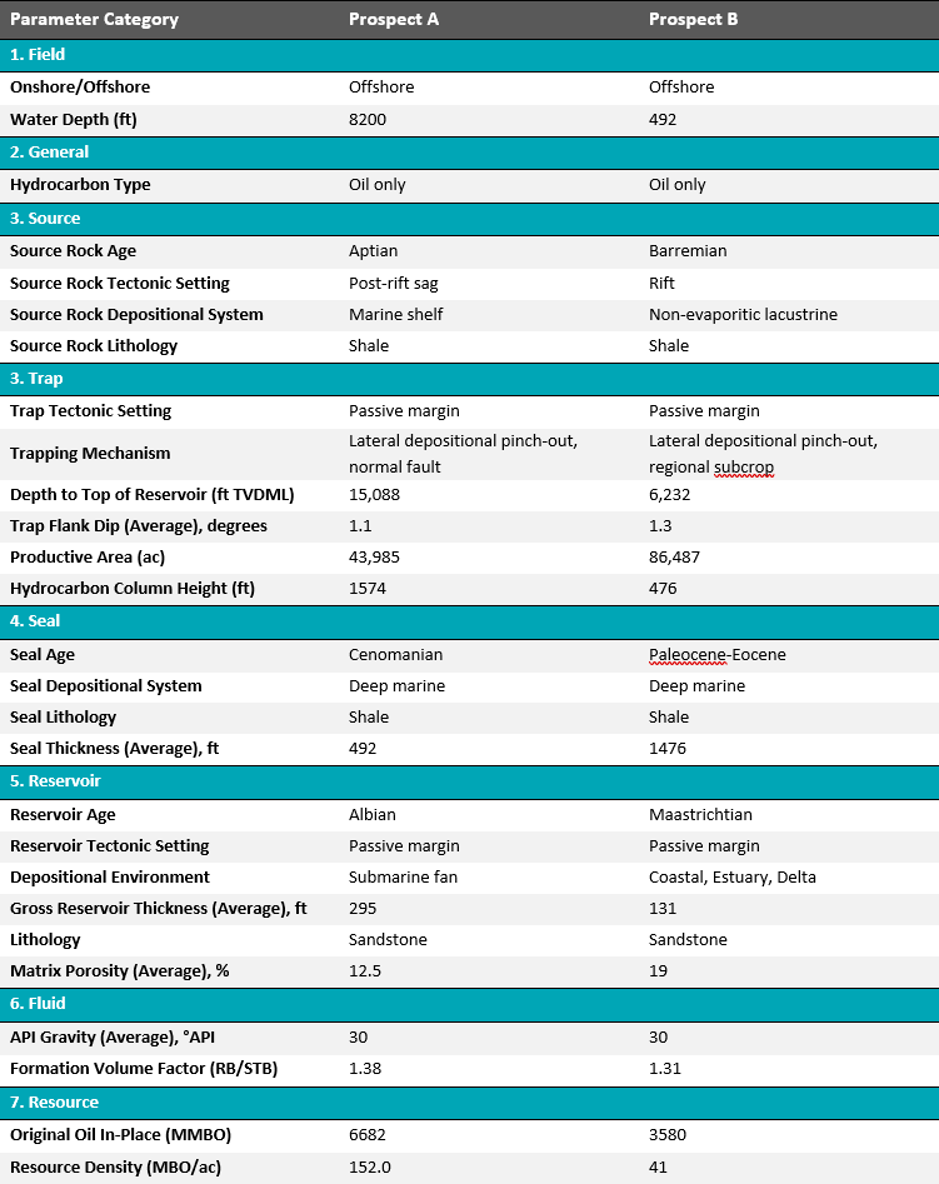
Table 1 – Key text and numeric parameters of Prospect A and Prospect B used for comparison to the analogue dataset. Abbreviations: TVDML = true vertical depth below mudline; RF/STB = reservoir barrel/stock tank barrel; MMBO = million barrels of oil; MBO = thousand barrels of oil.
Choose Relevant Analogues
The following selection criteria has been used to identify appropriate analogues:
33 analogous reservoirs were identified for Prospect A using three conditions: 1) offshore oil reservoirs; 2) submarine fan depositional environment of Cretaceous and Tertiary age; and 3) specific stratigraphic trapping mechanisms (lateral depositional pinch-out, clastic macroform and erosional trough-fill) (Fig. 4).
34 analogous reservoirs were identified for Prospect B using three conditions: 1) onshore or offshore oil reservoirs; 2) coastal depositional environment of Cretaceous age (shoreline-shelf, estuary, delta); and 3) specific stratigraphic trapping mechanisms (lateral depositional change, sub-unconformity truncation, onlap onto erosional surface, erosional trough-fill) (Fig. 5).
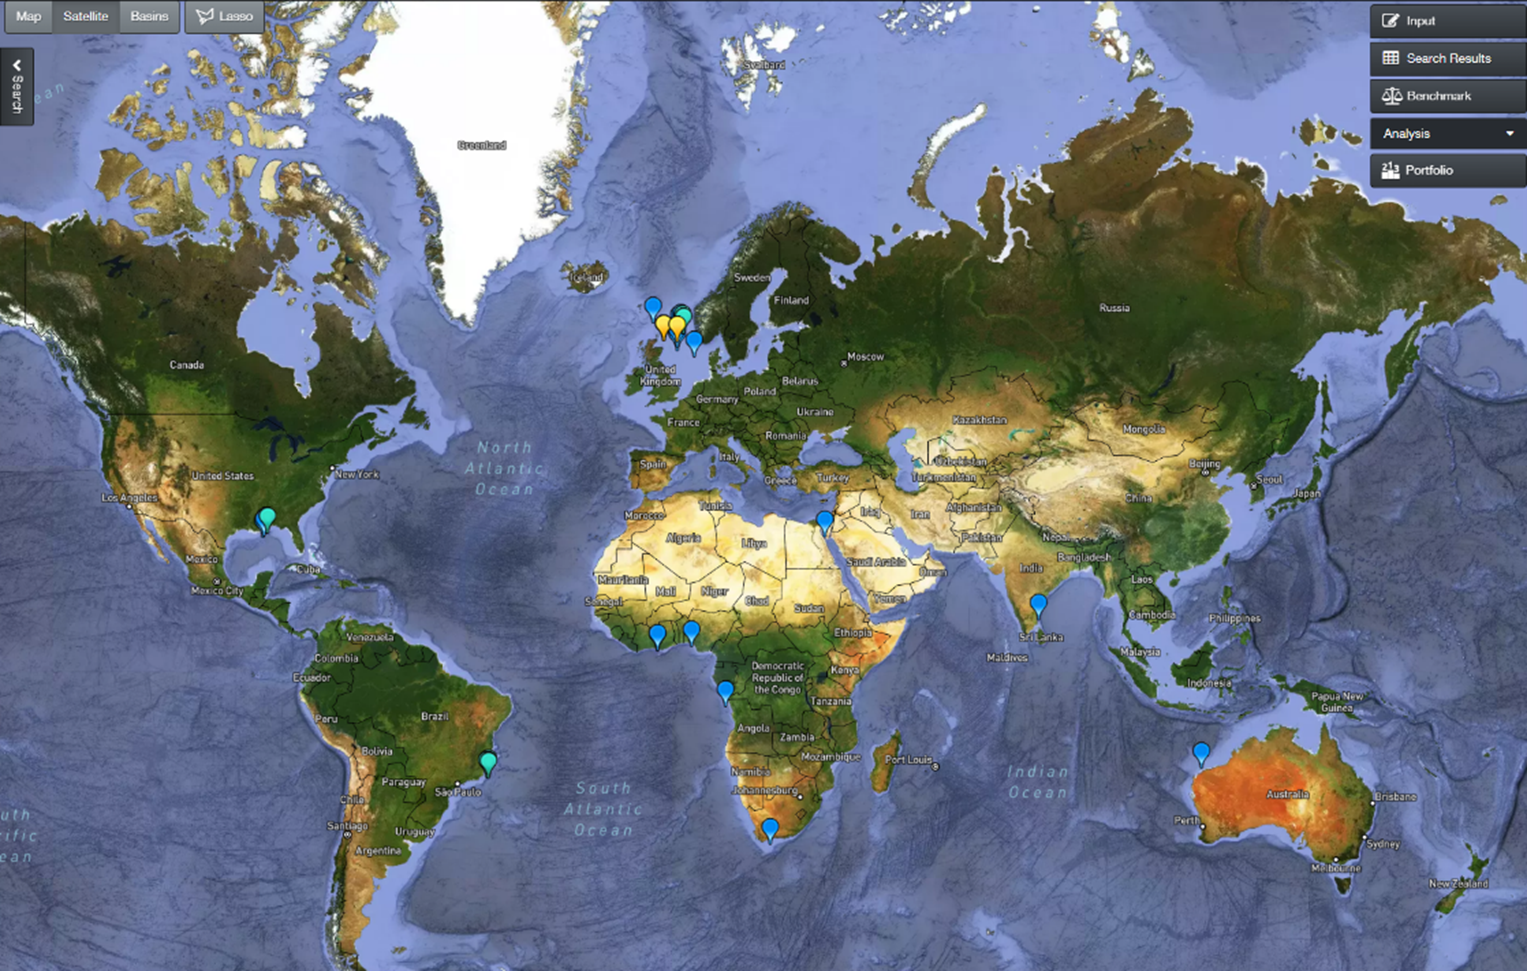
Fig. 4 – Reservoir analogues for Prospect A. These are chosen based on availability of high-quality data and as representative of key characteristics of submarine fan play.
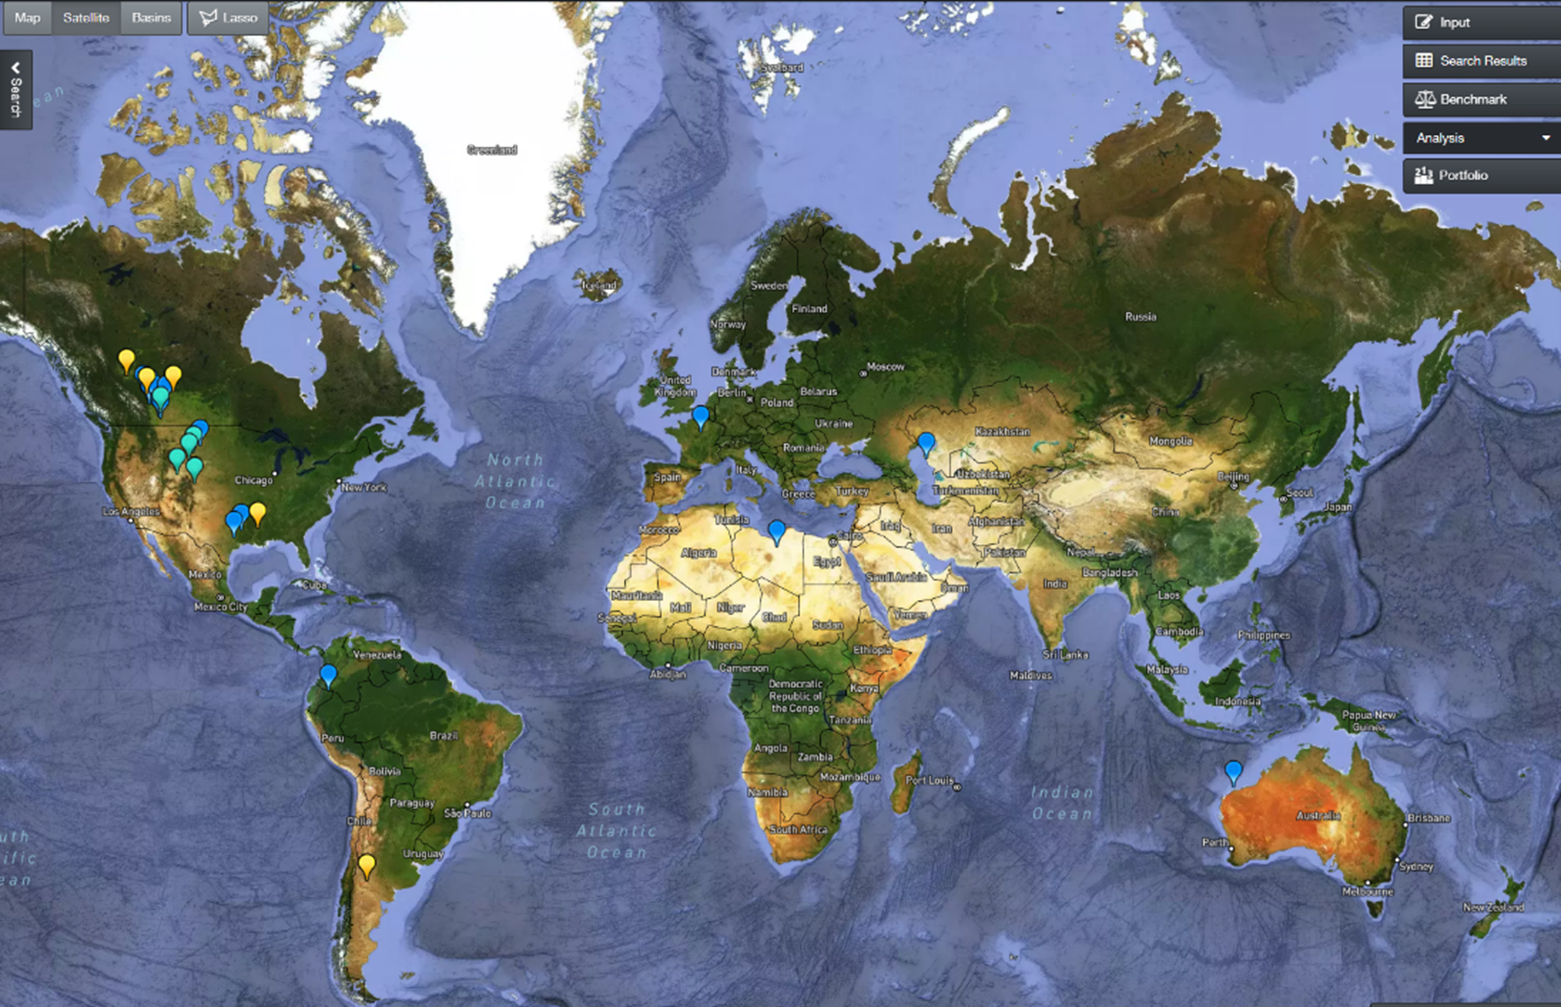
Fig. 5 – Reservoir analogues for Prospect B. These are chosen based on availability of high-quality data and as representative of key characteristics of shallow-marine sandstone play.
Benchmark Target or Characterize Analogues
Parameter Distribution and Uncertainty: A P90-P10 ratio is a convenient way to understand the full range of uncertainty for the studied parameters and serves to illustrate if a parameter is at the extreme of a distribution.
Prospect A – Cretaceous Turbidite Reservoir Play
The values for trap flank dip, API gravity and formation volume factor (FVF) are at the 84th, 50th and 30th percentile respectively (Table 2). This indicates that these are reasonable assumptions given the limited knowledge about the petroleum system.

Table 2 – Key numeric parameter values of Prospect A against probabilistic distribution of 90% to 10% range of analogues. Abbreviations: RB/STB = reservoir barrel/stock tank barrel; MMBO = million barrels of oil; MBO = thousand barrels of oil; P-Value = statistic position of benchmark target against probabilistic distribution of analogues; P10 = estimate exceeded with 10% probability; P50 = estimate exceeded with 50% probability; P90 = estimate exceeded with 90% probability.
Benchmarking of Prospect A against applicable global analogues suggest that certain parameters such as matrix porosity may be higher or sit within a higher range than currently modelled, and that other parameters such as productive area and original oil in-place (OOIP) are likely too large (3rd percentile) and should act as a note of caution for explorers in determining productive area from seismic alone (Table 2).
Further consideration to the relationship between hydrocarbon column height and trap flank dip is given in Fig. 6. Trends in analogues show thought should be given to the likely hydrocarbon column height, and that the modelled height sitting close to P10, is unlikely for a low trap flank dip prospect. Overall trapping geometry is likely to be smaller than currently modelled, which is likely to have positive economic implications as any potential development will be concentrated in a smaller area.
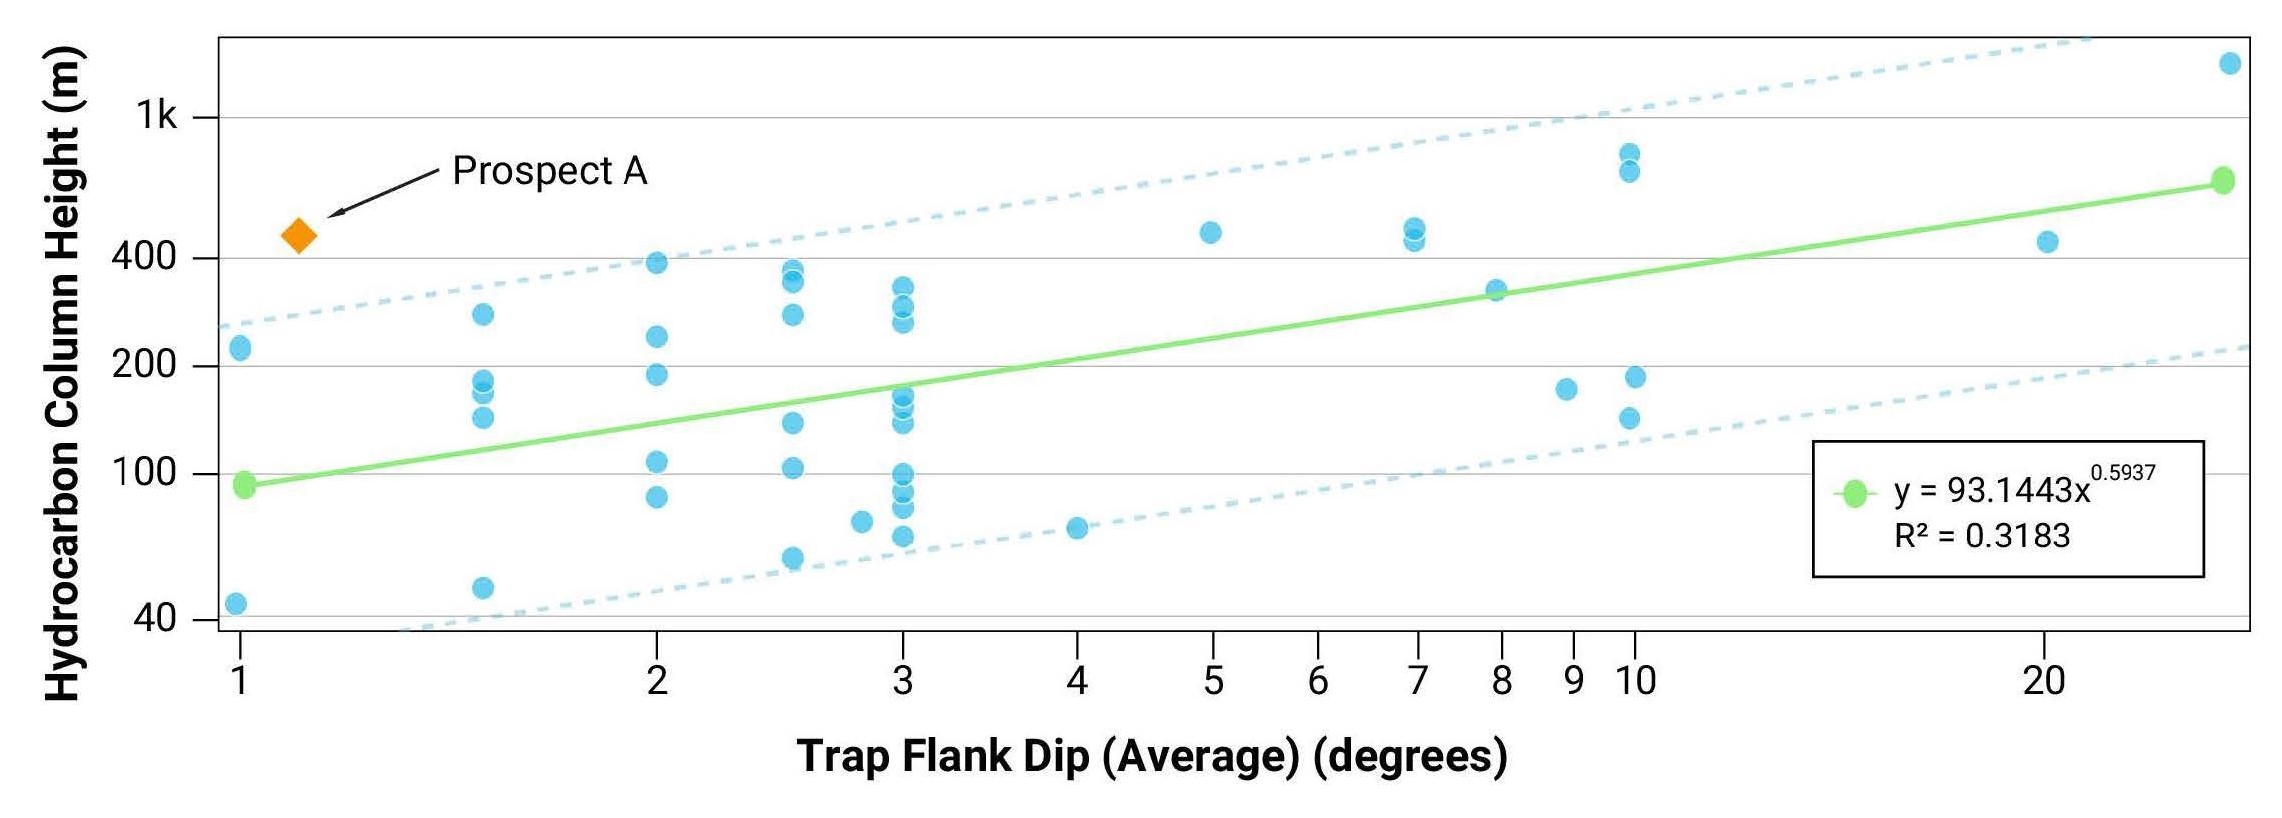
Fig. 6 – Cross-plot chart showing submarine-fan stratigraphic trap analogues: hydrocarbon column height versus trap flank dip. Boundary lines are projected on the same plane as the trend line based on the furthest minimum and maximum analogue outliers. Prospect A lies above the maximum analogue boundary line.
Both trap tectonic setting and trapping mechanism of this prospect are compatible with those of submarine-fan analogues. The most common tectonic setting for the submarine-fan lateral depositional pinch-out trap development is passive margin, followed by salt and sag (Fig 7.).

Fig. 7 – Histogram depicting frequency of occurrence for trap tectonic setting: Prospect A is dominated by passive margin, salt and sag.
Prospect B – Cretaceous Shallow-Marine Sandstone Pinch-out Trap Play
Benchmarking indicates that all eight parameters for Prospect B fall within the P90-P10 range of analogues (Table 3), and therefore suggest that the interpretation and assumptions made for this prospect are broadly reasonable.

Table 3 – Key numeric parameter values of Prospect B against probabilistic distribution of 90% to 10% range of analogues. Abbreviations: RB/STB = reservoir barrel/stock tank barrel; MMBO = million barrels of oil; MBO = thousand barrels of oil; P-Value = statistic position of benchmark target against probabilistic distribution of analogues; P10 = estimate exceeded with 10% probability; P50 = estimate exceeded with 50% probability; P90 = estimate exceeded with 90% probability.
Given the prospect’s trap flank dip (1.3˚), both the original hydrocarbon column height and productive area are reasonable (Fig. 8).
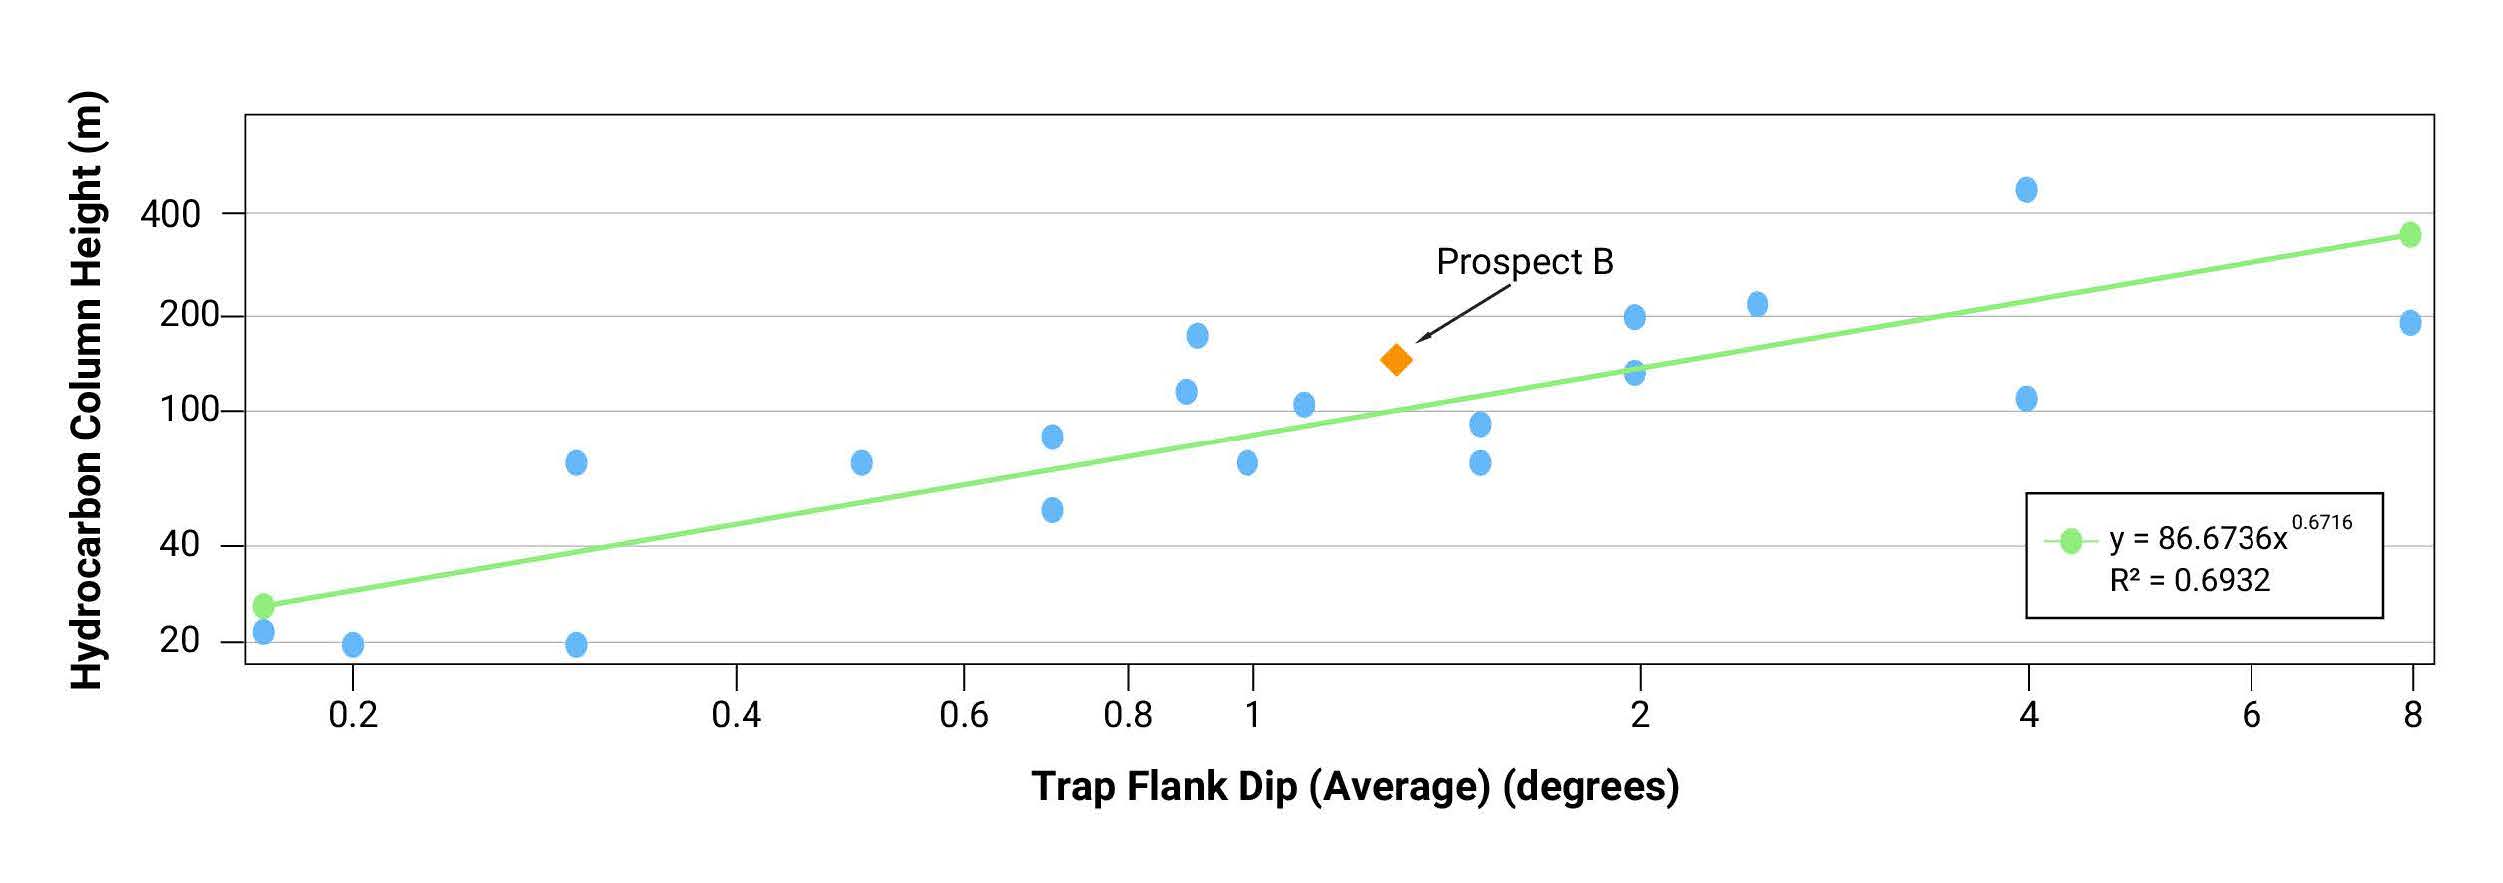
Fig. 8 – Hydrocarbon column height versus trap flank dip cross-plot for the shallow-marine sandstone stratigraphic trap analogues. Prospect B follows the trend line.
Despite the interpreted thick top seal for Prospect B, benchmarking by analogues suggests seal is the critical risk for this prospect. Prospect B is interpreted to be a Late Cretaceous stratigraphic pinch-out trap sealed by transgressive Paleocene shales. Stratigraphic traps in passive margin settings for this play concept occur much less frequently (Fig. 9), with only four analogous examples in the dataset. These fields require either combination trapping with a structural component (e.g., Stag Field) and regional truncation (e.g., Delhi, East Texas and Kurten fields). These analogous fields from diverse geographic settings can provide insight into successful trapping configurations in similar structural and stratigraphic settings.
The evidence from analogues also give confidence that, despite the less frequent occurrence of these types of stratigraphic traps in passive margin settings, the appropriate conditions exist such that the occurrence for Prospect B can be considered likely.

Fig. 9 – Histogram depicting frequency of occurrence for trap tectonic setting: Prospect B is dominated by foreland basin analogues.
Identify Best Practices
Use of the Conjugate Margin as an Analogue:
The source petroleum system element is perhaps the most challenging to benchmark due to the uncertainty inherent in determining viable sourcing for a play prior to exploration drilling. Evidence from conjugate passive margins, separated by plate tectonics, but sharing similar stratigraphy, is a key source of analogue information. On the conjugate margin to the Pelotas and Punta del Este Basins, recent work has determined that Aptian source rocks are regionally extensive from the Luderitz and Walvis basins in Namibia to the southern margin of the Orange Basin in South Africa. These basins, like the Pelotas and Punta del Este Basins on the other side of the Atlantic, have a rifted crustal architecture with an outer high feature that formed during the rifting of the Atlantic.
The Aptian source deposited on either side of this high is noted by workers as possessing a distinct seismic response, specifically the characteristics of a Type IV AVO anomaly (Davison et al., 2018; Eastwell et al., 2018; Hodgson et al., 2021). Recent data from the Graff-1 well, offshore southern Namibia, confirmed the presence of a working petroleum system in the Orange Basin, in a slope channel system with a stratigraphic trap (Blakeley, 2022; Van Der Spuy and Sayidini, 2022).
Use of Global Analogues for Petroleum Systems Insight:
Global analogues, while not directly comparable for source presence or quality, can augment the data from the conjugate margin, and provide valuable insight into the potential to charge similar trapping configurations. For instance, one of the passive-margin analogues identified for Prospect B, Stag Field (Fig. 9) has no mature source rocks in the immediate vicinity of the field, suggesting hydrocarbons have migrated laterally and updip, in several phases, from a source kitchen in the adjacent Lewis Trough (Crowley and Collins, 1996). Similarly, the other three passive margin analogues identified in Figure 9 ̶ that are the only successful examples of this trapping style in passive margins within the dataset ̶ all indicate that a lateral migration component was a key factor in charging these fields.
The use of regional analogues from the conjugate margin, combined with evidence from global analogues that suggest lateral migration is a common process by which to charge stratigraphic pinch-out traps (in the case of Prospect B), can give confidence in assessing the risk associated with the source petroleum system element, and be used to constrain uncertainty for future identified prospects within this play.
Conclusions
Prospect A’s interpretation can be said to be on the high side of the analogue distribution since both the productive area and original oil in-place lie below the P10 of those from analogues. Hydrocarbon column height also lies above the maximum analogue boundary line for its low trap flank dip. Future work could be conducted, such as detailed seismic mapping to define closure and therefore maximum possible column height and area, to further constrain the potential of this prospect, or justify the current interpretation on the high side of the analogue distribution.
The interpreted parameters for Prospect B can be said to be reasonable, in that all the studied eight parameters are within the P90-P10 of the analogue population for a given parameter. Significant uncertainty in seal integrity exists for this prospect as currently defined. However, detailed analysis of the context of the play and prospect based on seismic geometry suggests that the appropriate conditions exist such that the occurrence for Prospect B can be considered likely. Future work should focus on isolating the specific trapping conditions related to Prospect B, in the context of this direct analogue, with an aim to reduce the uncertainty currently present in the prospect’s definition.
References
Blakeley, I., 2022, Graff-1: On the Cusp of Hydrocarbon Success in Namibia: <http://www.geoexpro.com/articles/2022/03/graff-1-on-the-cusp-of-hydrocarbon-success in-namibia> (accessed May 12, 2022).
Crowley, J., and E. S. Collins, 1996, The Stag Oilfield: The APPEA Journal, v. 36, no. 1, p. 130–141, doi:10.1071/aj95008.
Davison, I., K. Rodriguez, and D. Eastwell, 2018, Seismic Detection of Source Rocks: <http://www.geoexpro.com/articles/2018/12/seismic-detection-of-source-rocks> (accessed May 12, 2022).
Eastwell, D., N. Hodgson, and K. Rodriguez, 2018, Source rock characterization in frontier basins — a global approach: First Break, v. 36, no. 11, p. 53–60, doi:10.3997/1365-2397.n0131.
Hodgson, N., K. Rodriguez, and J. Davies, 2021, South Africa Poised for Exploration Greatness: <http://www.geoexpro.com/articles/2021/11/south-africa-poised-for-exploration greatness> (accessed May 12, 2022).
Van Der Spuy, D., and B. Sayidini, 2022, Offshore Namibia Discovery Signals Bright Future for South Africa Oil and Gas: <https://explorer.aapg.org/story/articleid/62613> (accessed May 12, 2022).
