Introduction
This case study demonstrates the efficacy of C&C Reservoirs’ Benchmarking Workflow in the identification of upside recovery potential; and will focus on Target A, a fractured microporous carbonate oil reservoir in the Middle East. For confidentiality reasons, the target reservoirs have been anonymized and specific details have been omitted. The analogues selected for this case history represent both high- and low-side outcomes and therefore encompass the range of uncertainty inherent to the production of hydrocarbons.
Target A
Target A consists of fractured chalky limestones containing 29 °API gravity oil and is characterized by microporosity and a low matrix permeability (<1 mD). The reservoir has an original oil in-place of close to one billion barrels and an expected ultimate recovery factor of 10%. Initial production was under moderate aquifer and solution-gas. Fluid-conductive faults and fractures cut through the structural crest and connect to a deep aquifer. The reservoir was developed with horizontal and multilateral wells, which, owing to early water breakthrough on the structural crest, were drilled mainly on the field flanks where the reservoir is relatively weakly fractured. After 20 years of production, recovery-to-date was less than 4% of STOIIP with a water-cut of 67%.
The C&C Reservoirs Benchmarking Workflow
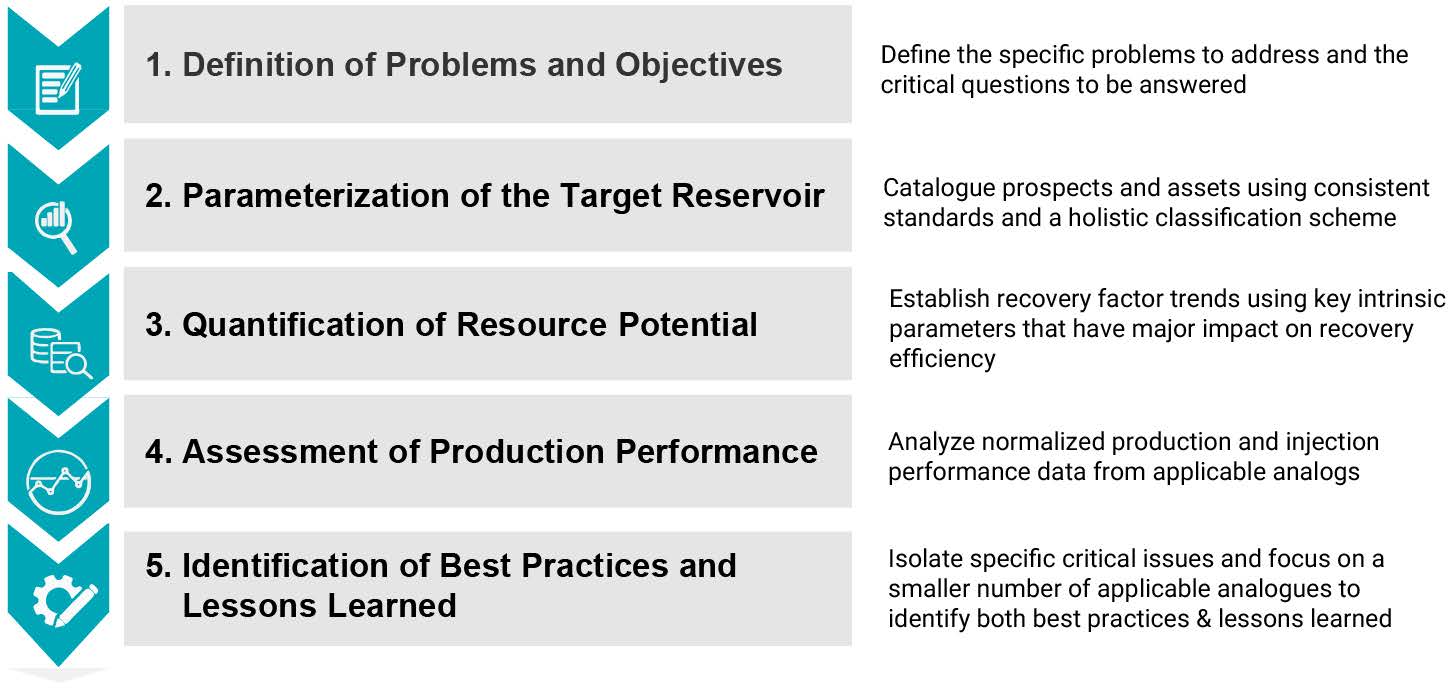
Fig. 1 – Flow chart illustrating key steps in the analog benchmarking workflow and summarizing the requirements at each step.
Step 1: Define Problems and Objectives
Given the production challenges faced by Target A, the key questions of this study are:
- Can we better understand and quantify the potential expected ultimate recovery?
- What best practices can be identified, and possibly implemented, from better-performing global reservoir analogues?
- What lessons can we learn from poorer-performing global reservoir analogues?
Step 2: Parameterization of the Target Reservoir
Based on data provided, both text and numeric parameters have been standardized and classified using the consistent rules of C&C Reservoirs’ comprehensive classification scheme. Initial analogue selection is based on a broad set of parameters to establish a trend in recovery factor. The following selection criteria (Table 1) have been used to identify appropriate analogues. From this selection, 25 relevant global analogues were identified.

Table 1 – Analogue search matrix for the Target A reservoir.
Step 3: Quantification of Resource Potential
The impact of key intrinsic parameters on recovery efficiency was evaluated and a recovery factor trend established (Fig. 2). The strong correlation between estimated ultimate recovery factor and a derivation of air permeability, viscosity, and initial water saturation indicates that these three parameters bear a fundamental control on recovery efficiency. Benchmarking Target A against the recovery trend of analogues demonstrates that Target A has a potential recovery of 16%, compared to 10% recovery currently expected (Fig. 2).
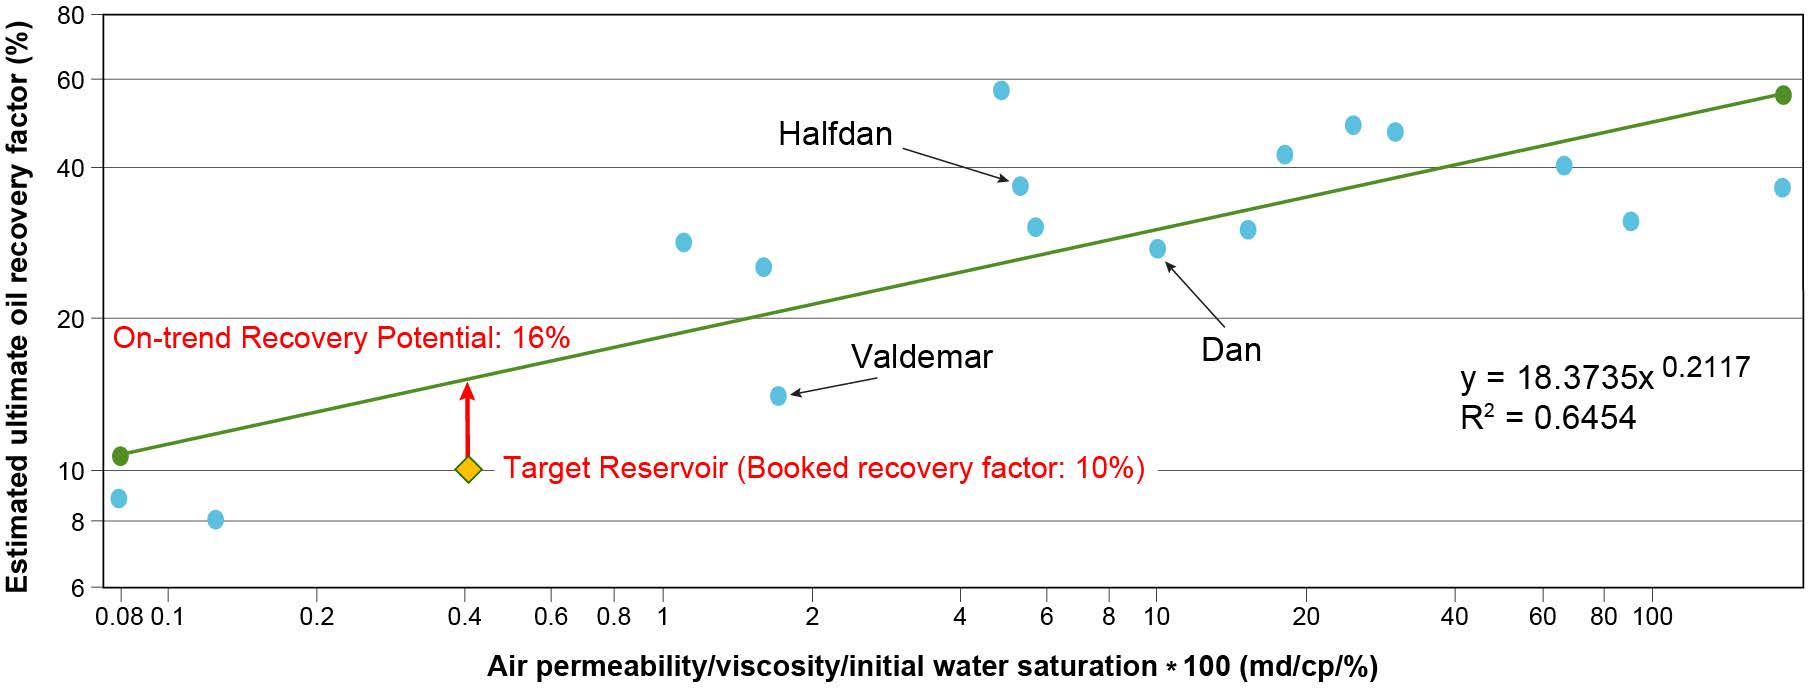
Fig. 2 – Estimated ultimate oil recovery factor versus air permeability/viscosity/initial water saturation crossplot for 15 fractured microporous oil reservoirs for which reliable air permeability, oil viscosity, and initial water saturation are available. These parameters were selected from the analogue group because they bear a strong control on recovery efficiency.
Step 4: Assessment of Production Performance
One of the key production challenges facing the redevelopment of Target A is the control and management of water production. Water-cut performance from analogues can offer significant insight into conformance-improvement best practices. The analogue selection is then further refined to focus on a narrowly defined set of parameters (Table 2).

Table 2 – Refined analogue search matrix for the Target A, focusing on water-cut performance.
Thirteen relevant global analogues were selected, and the production characteristics of these analogues are given in Table 3. Most analogues have a relatively short plateau duration of 12-67 months with an average of 24 months. Plateau annual recovery (% of in-place oil) ranges from 1 to 4% with an average of 1.4%. Horizontal wells adopting cased-hole completions represent the most effective option for field development.
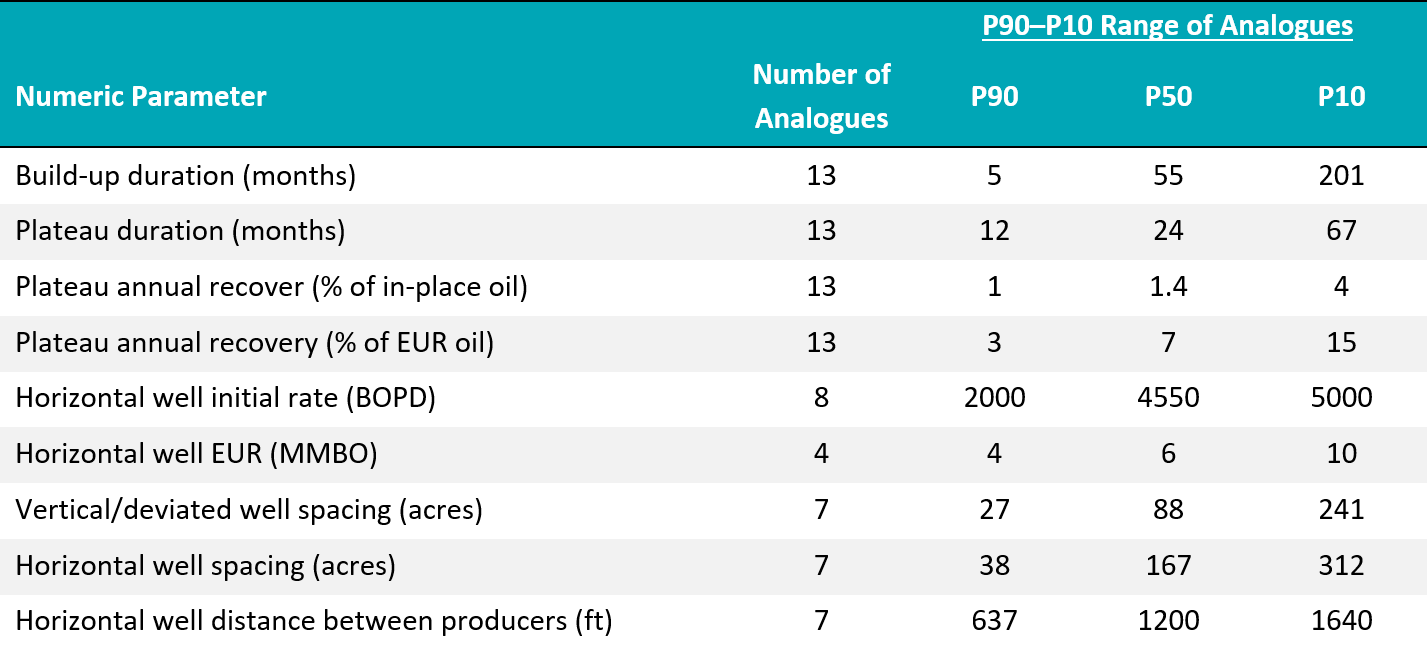
Table 3 – Probabilistic distribution of P90–P10 range of analogues showing production characteristics for the 13 offshore fractured microporous oil reservoirs.
The recovery efficiency chart shows two trends in water-cut performance (Fig. 3): (1) early water breakthrough evident in a rapid rise in water-cut; and (2) a gradual rise in water-cut. The poorly-performing analogues are characterized by relatively low plateau annual recovery ranging from 0.9 to 1.2% (of STOIIP) and high initial saturation of 40 to 50%, and, owing to a lack of effective water control, only achieved an ultimate recovery factor of <15% (Fig. 4). In contrast, the better-performing analogues are characterized by higher plateau annual recovery ranging from 1.5 to 2.5% (of STOIIP) and have adopted effective reservoir management practices and achieved a higher ultimate recovery factor of >28% (Fig. 4).
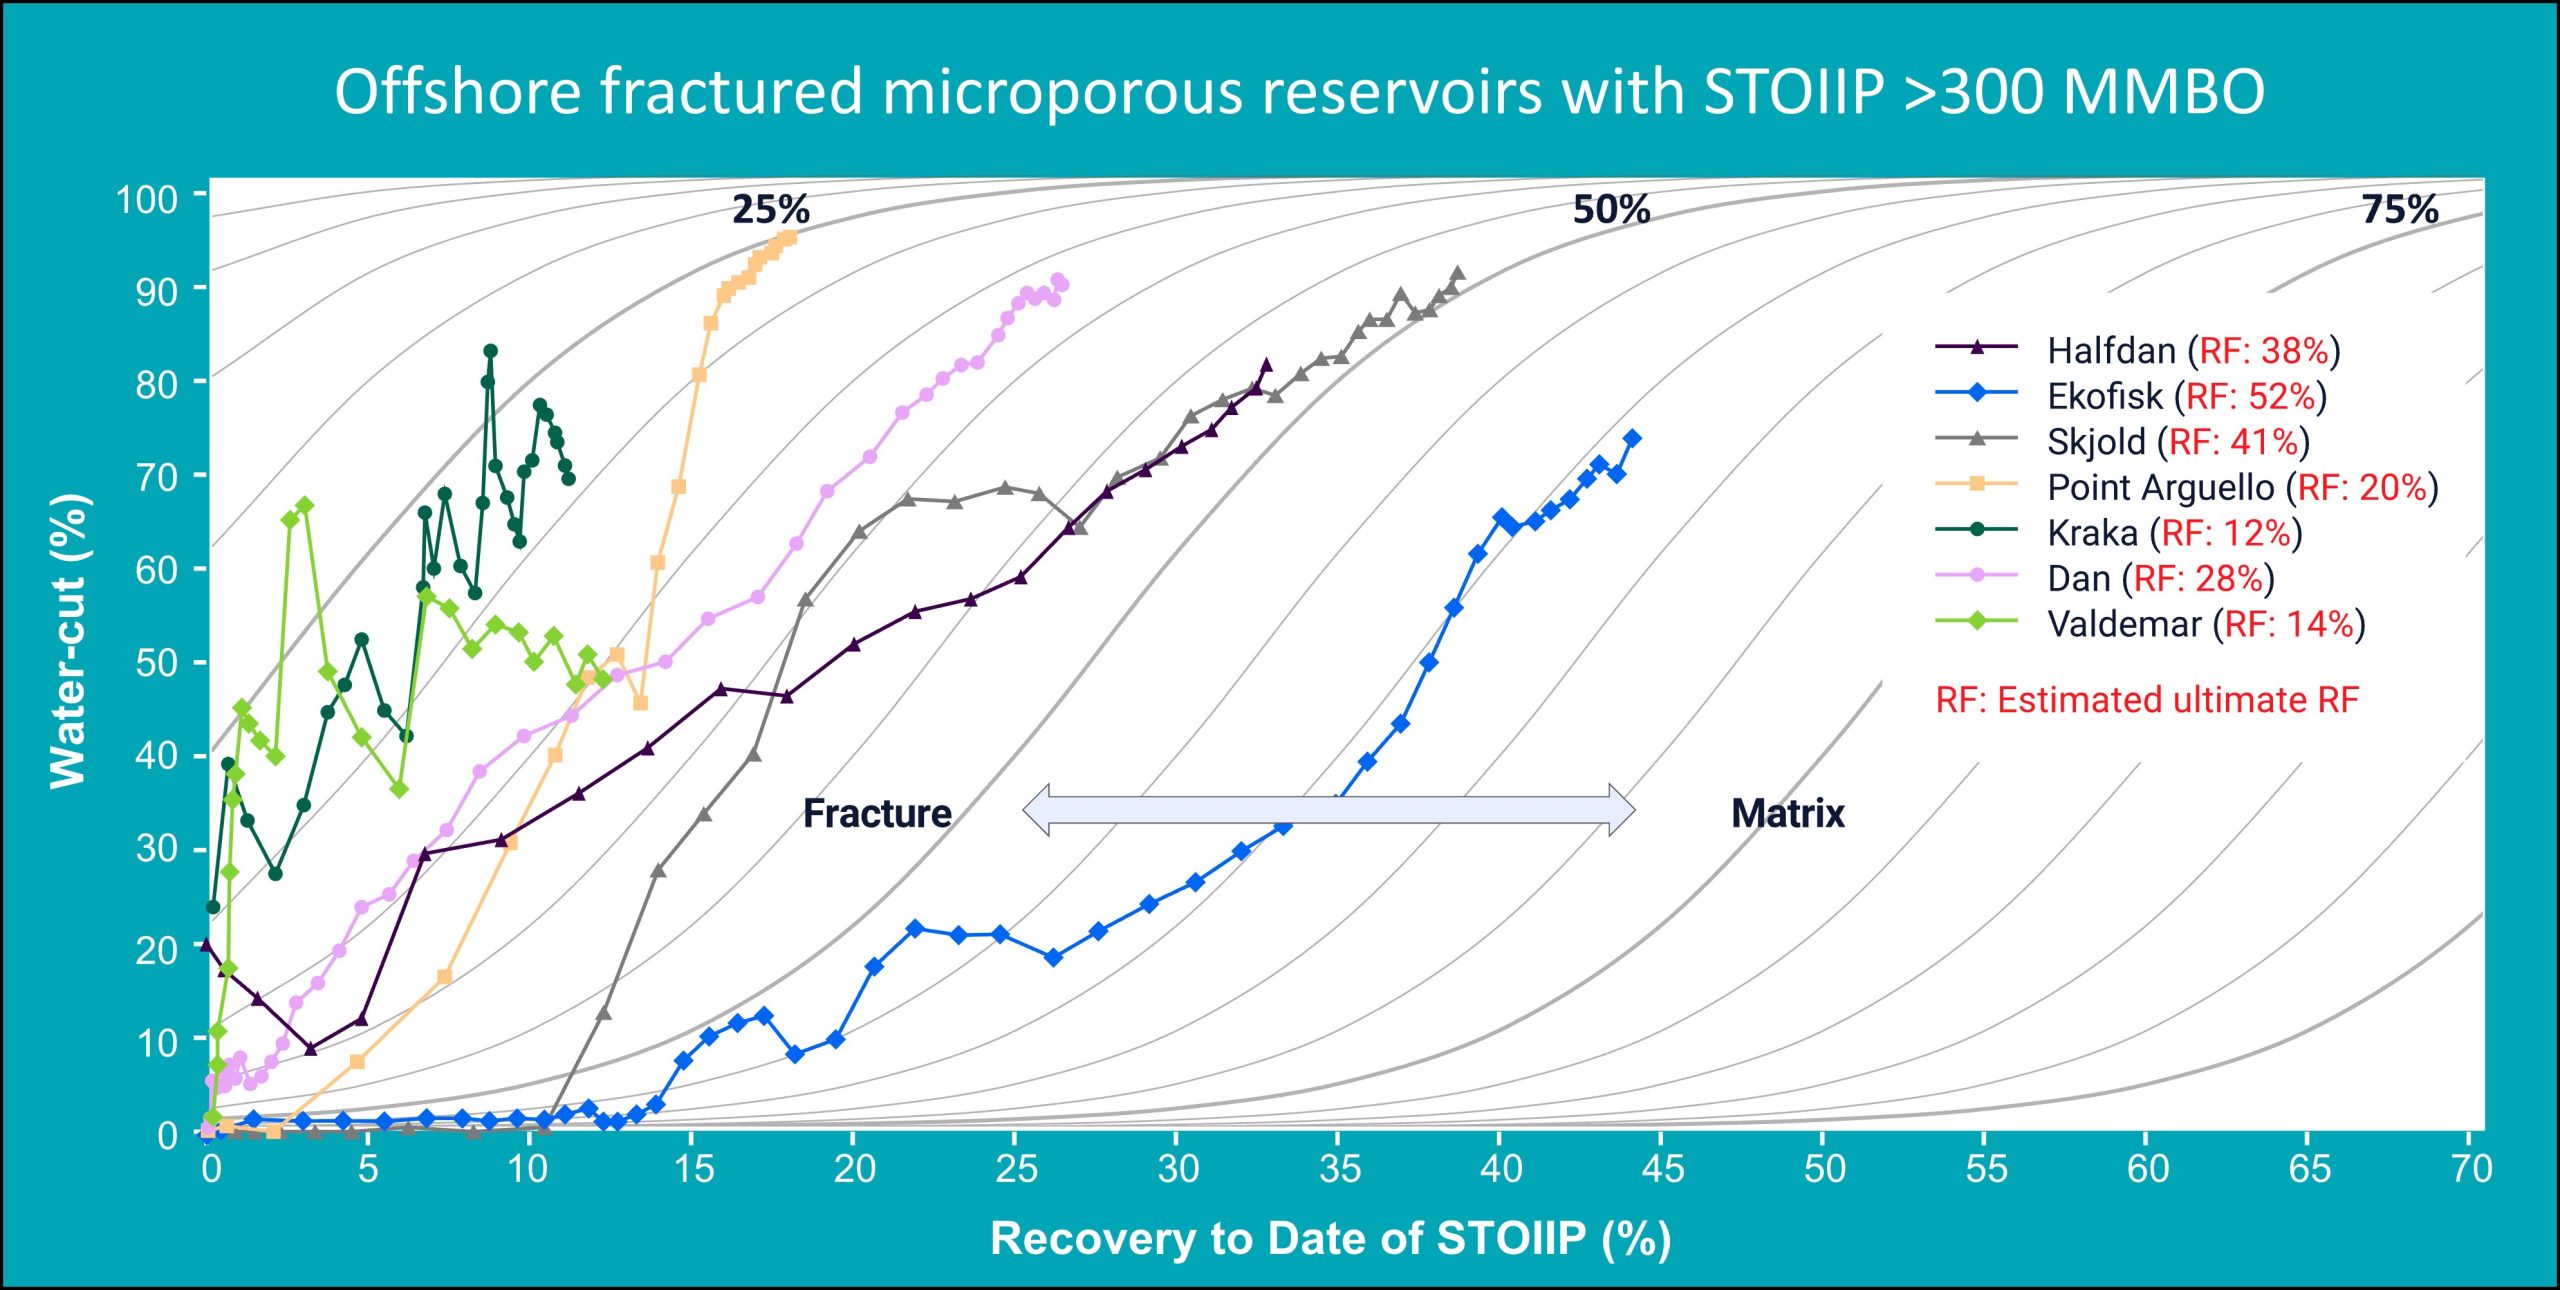
Fig. 3 – Normalized production performance chart for seven offshore fractured microporous oil reservoirs for which reliable production data are available: water-cut versus recovery-to-date (% of in-place oil).
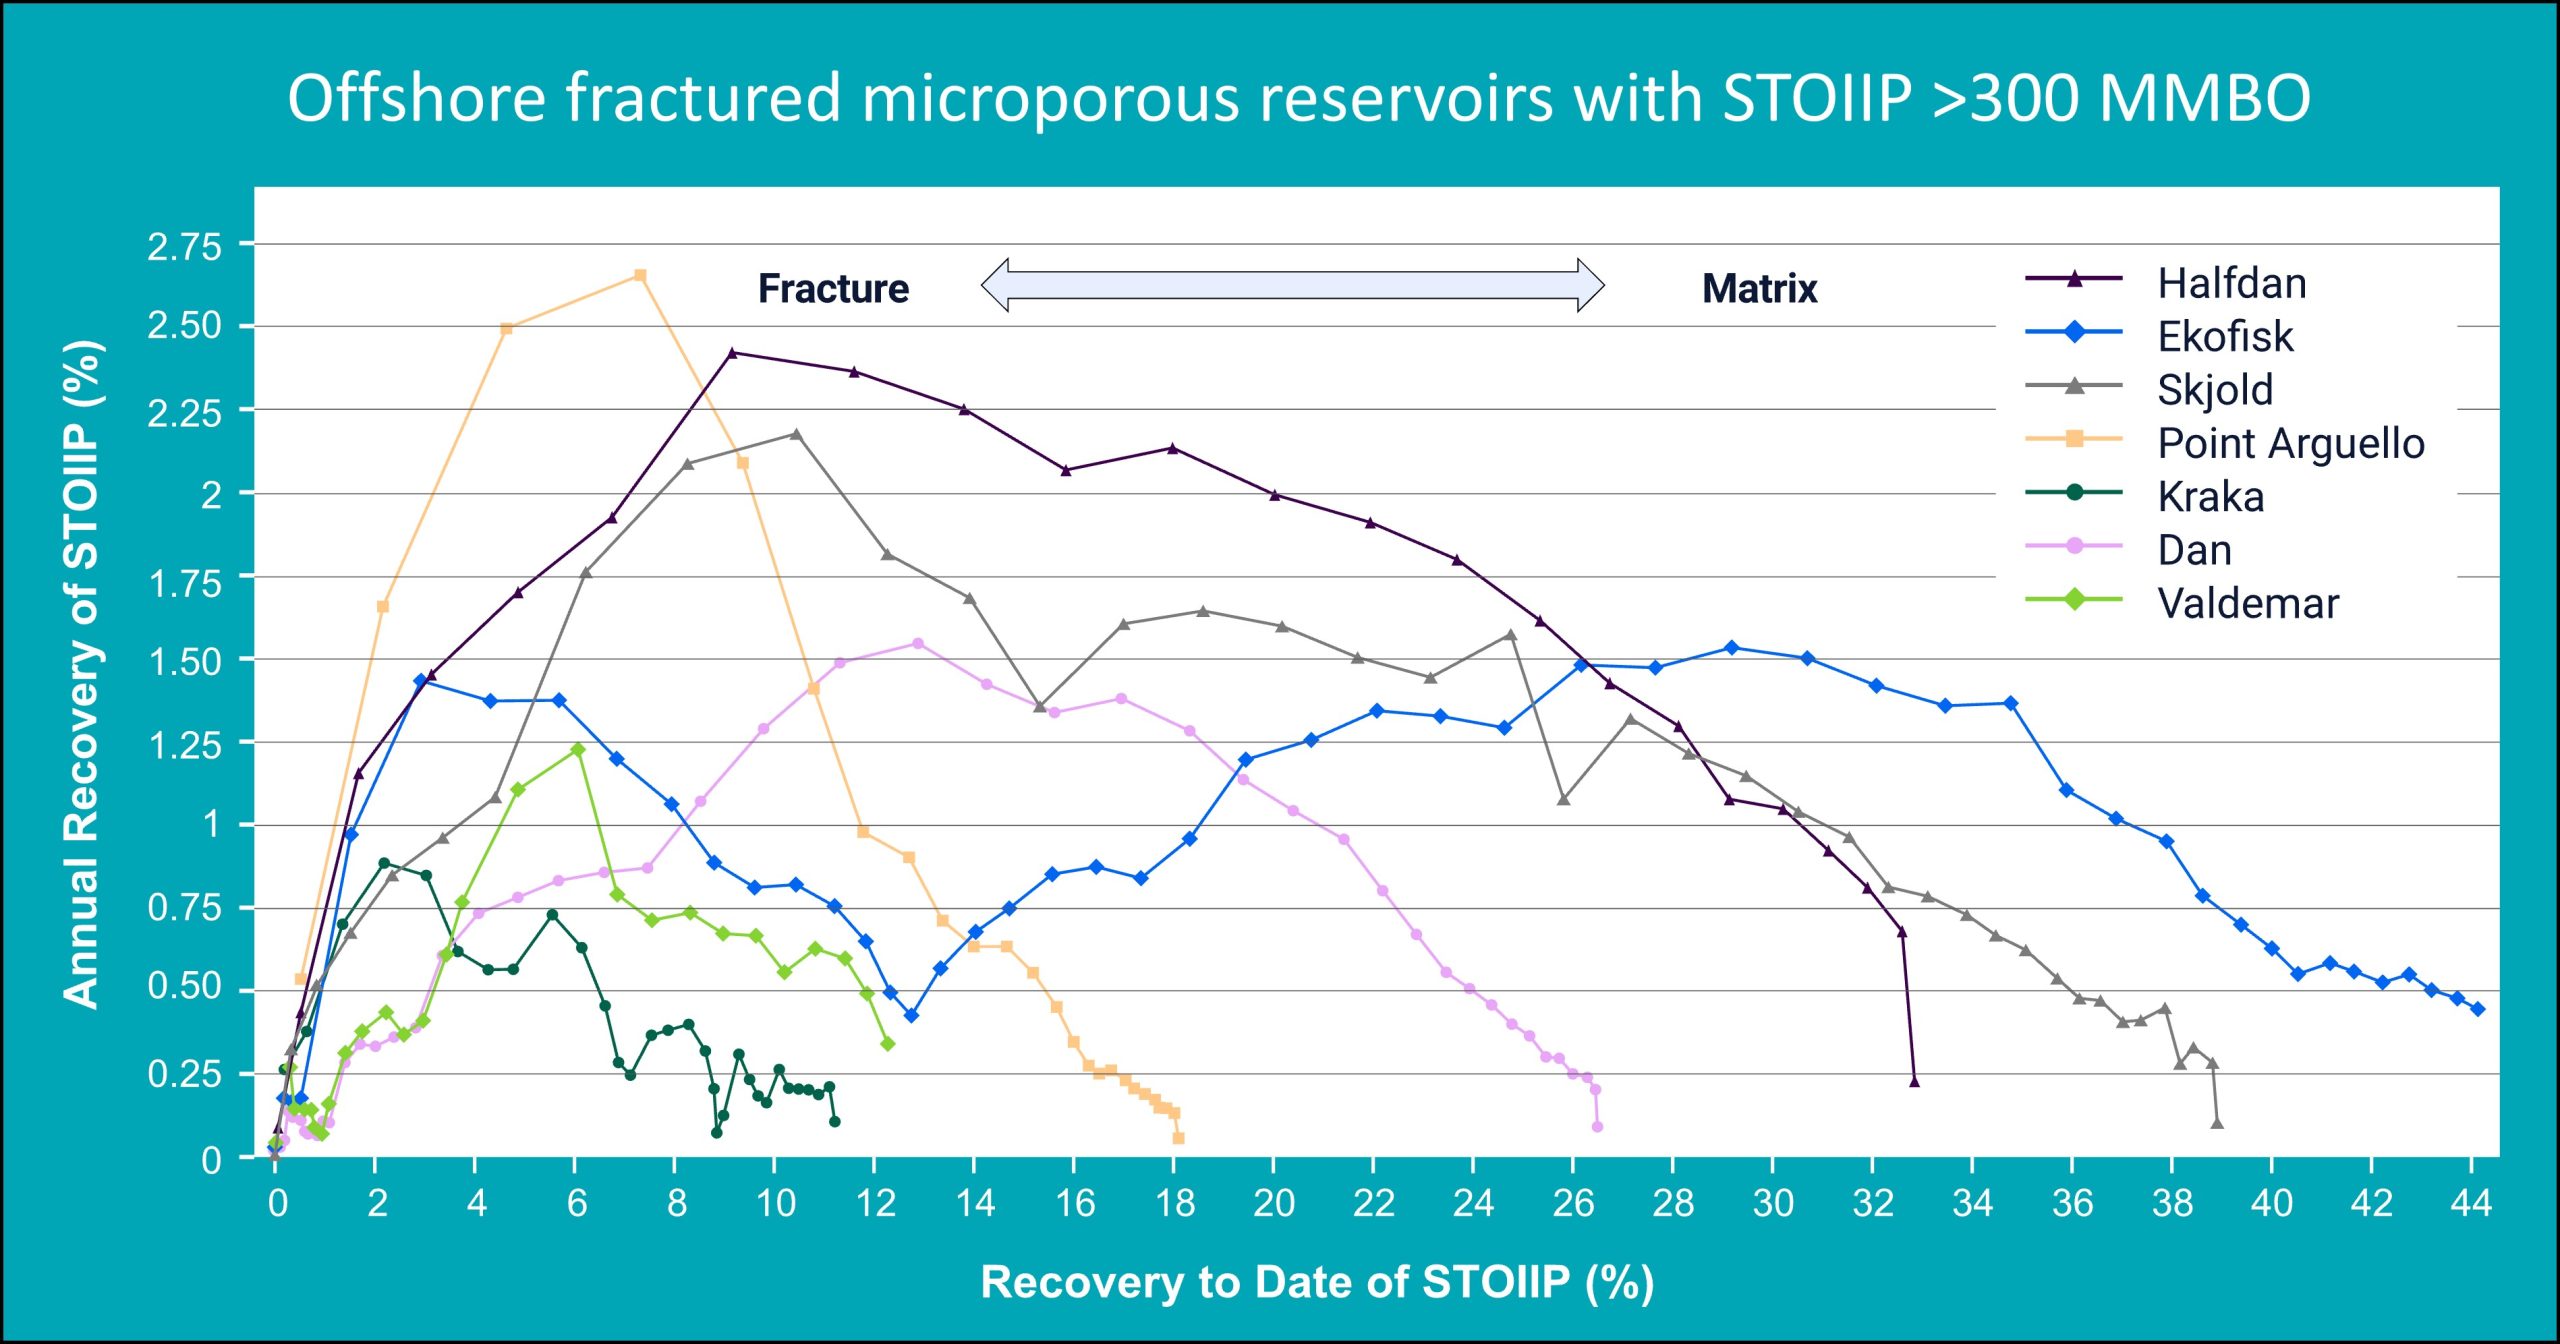
Fig. 4 – Normalized production performance chart for seven offshore fractured microporous oil reservoirs for which reliable production data are available: annual recovery (expressed as % of in-place oil) versus recovery-to-date (as a percentage of in-place oil).
Step 5: Identification of Best Practices and Lessons Learned
The final step of the workflow is a detailed examination of best practices and lessons learned. Three analogues with similar reservoir characteristics and production challenges to Target A have been selected to demonstrate both the high and low side of recovery efficiency: the Halfdan, Dan, and Valdemar fields, offshore Denmark (Fig. 2).
High-Side Outcome: Upper Cretaceous-Paleocene Chalk Reservoir, Halfdan Field, Denmark. The Halfdan Field produces oil from a water-wet chalk reservoir. Multiple acid fractures are induced in the producers to maximize productivity, whereas fractures in the injectors are induced by high-rate water injection to increase injectivity, enhance sweep geometry, and achieve voidage replacement (Lafond et al. 2010). Early producers typically suffered from lift problems owing to a combination of low solution-gas/oil ratio and water-cuts of ~20 to 40%. These problems were alleviated by pressure support from adjacent injectors within a year of injection startup. Selective completions provided control of individual production and injection zones, while preventing early water breakthrough and allowing control of water injection distribution. Production peaked at 106,846 BOPD in 2005 before falling gradually to 41,095 BOPD in 2018 when the field had produced 502 MMBO or 31% of STOIIP (Fig. 5a). Successful implementation of high-rate water injection, horizontal drilling, and acid stimulation led to an estimated ultimate recovery factor of 38%.
Mid-case Outcome: Upper Cretaceous-Paleocene Chalk Reservoir, Dan Field, Denmark. The Dan Field produces oil from a water-wet chalk reservoir. During 1987-1990, six >2,500 ft-long horizontal wells were drilled and stimulated with multiple sand-propped fractures (Larsen et al. 1997). Water was injected at high rates and above fracture-propagation pressure, creating fractures up to 4,000 ft long and 200-400 ft high. The hydraulically fractured horizontal wells showed an average fourfold production increase compared to the conventional producers. Hydraulic fracturing of horizontal wells coupled with implementation of seawater injection into deviated wells led to a significant increase in oil production during 1987–1997 (Fig. 5b). Selective completions were used to isolate individual fractures and control the injection rate. From 1997 onward, drilling of high-rate horizontal water injectors caused a marked increase in production, which reached a peak of 118,536 BOPD in 2000. Despite further drilling of two or three horizontal wells per year, production declined steadily thereafter to 20,000 BOPD with an average water-cut of 89% in 2018. Successful implementation of advanced drilling and completion technologies and effective water injection led to an estimated ultimate recovery factor of 28%.
Low-Side Outcome: Lower Cretaceous Chalk Reservoir, Valdemar Field, Denmark. The Valdemar Field produces oil from a mixed-wettability chalk reservoir. Production through four horizontal wells was mostly <3,000 BOPD, but a long horizontal well drilled in 2001 increased production to 8,435 BOPD with a water-cut of 40% by 2004. An additional 15 long horizontal wells subsequently increased production dramatically, peaking at 24,298 BOPD with a water-cut of 36.5% in 2009 (Fig. 5c). Owing to the low reservoir permeability, the wells have been hydraulically fractured (Navarro and Heer 2014). A typical horizontal well has a ~10,000 ft-long lateral section and is completed with 12–16 sand-propped fracture stages spaced ~650 ft apart, designed to connect the full reservoir thickness. In 2010, oil rates fell sharply to an average of 15,662 BOPD with a water-cut of 57%. Despite the drilling of two more horizontal producers, production continued to decline, reaching 11,168 BOPD with a water-cut of 52% in 2018 from 21 active producers. By the end of 2018, the field had produced 86.3 MMBO, representing 12% of STOIIP. Owing to the mixed wettability of the reservoir, water injection at Valdemar would likely be slow and ineffective. Poor control of water production and lack of effective secondary recovery programs led to an estimated ultimate recovery factor of only 14%. Recent numerical modelling indicates that up to ~83 MMBO could be recovered using continuous lean gas injection, resulting in incremental recovery of 11.5% (Suicmez 2019).
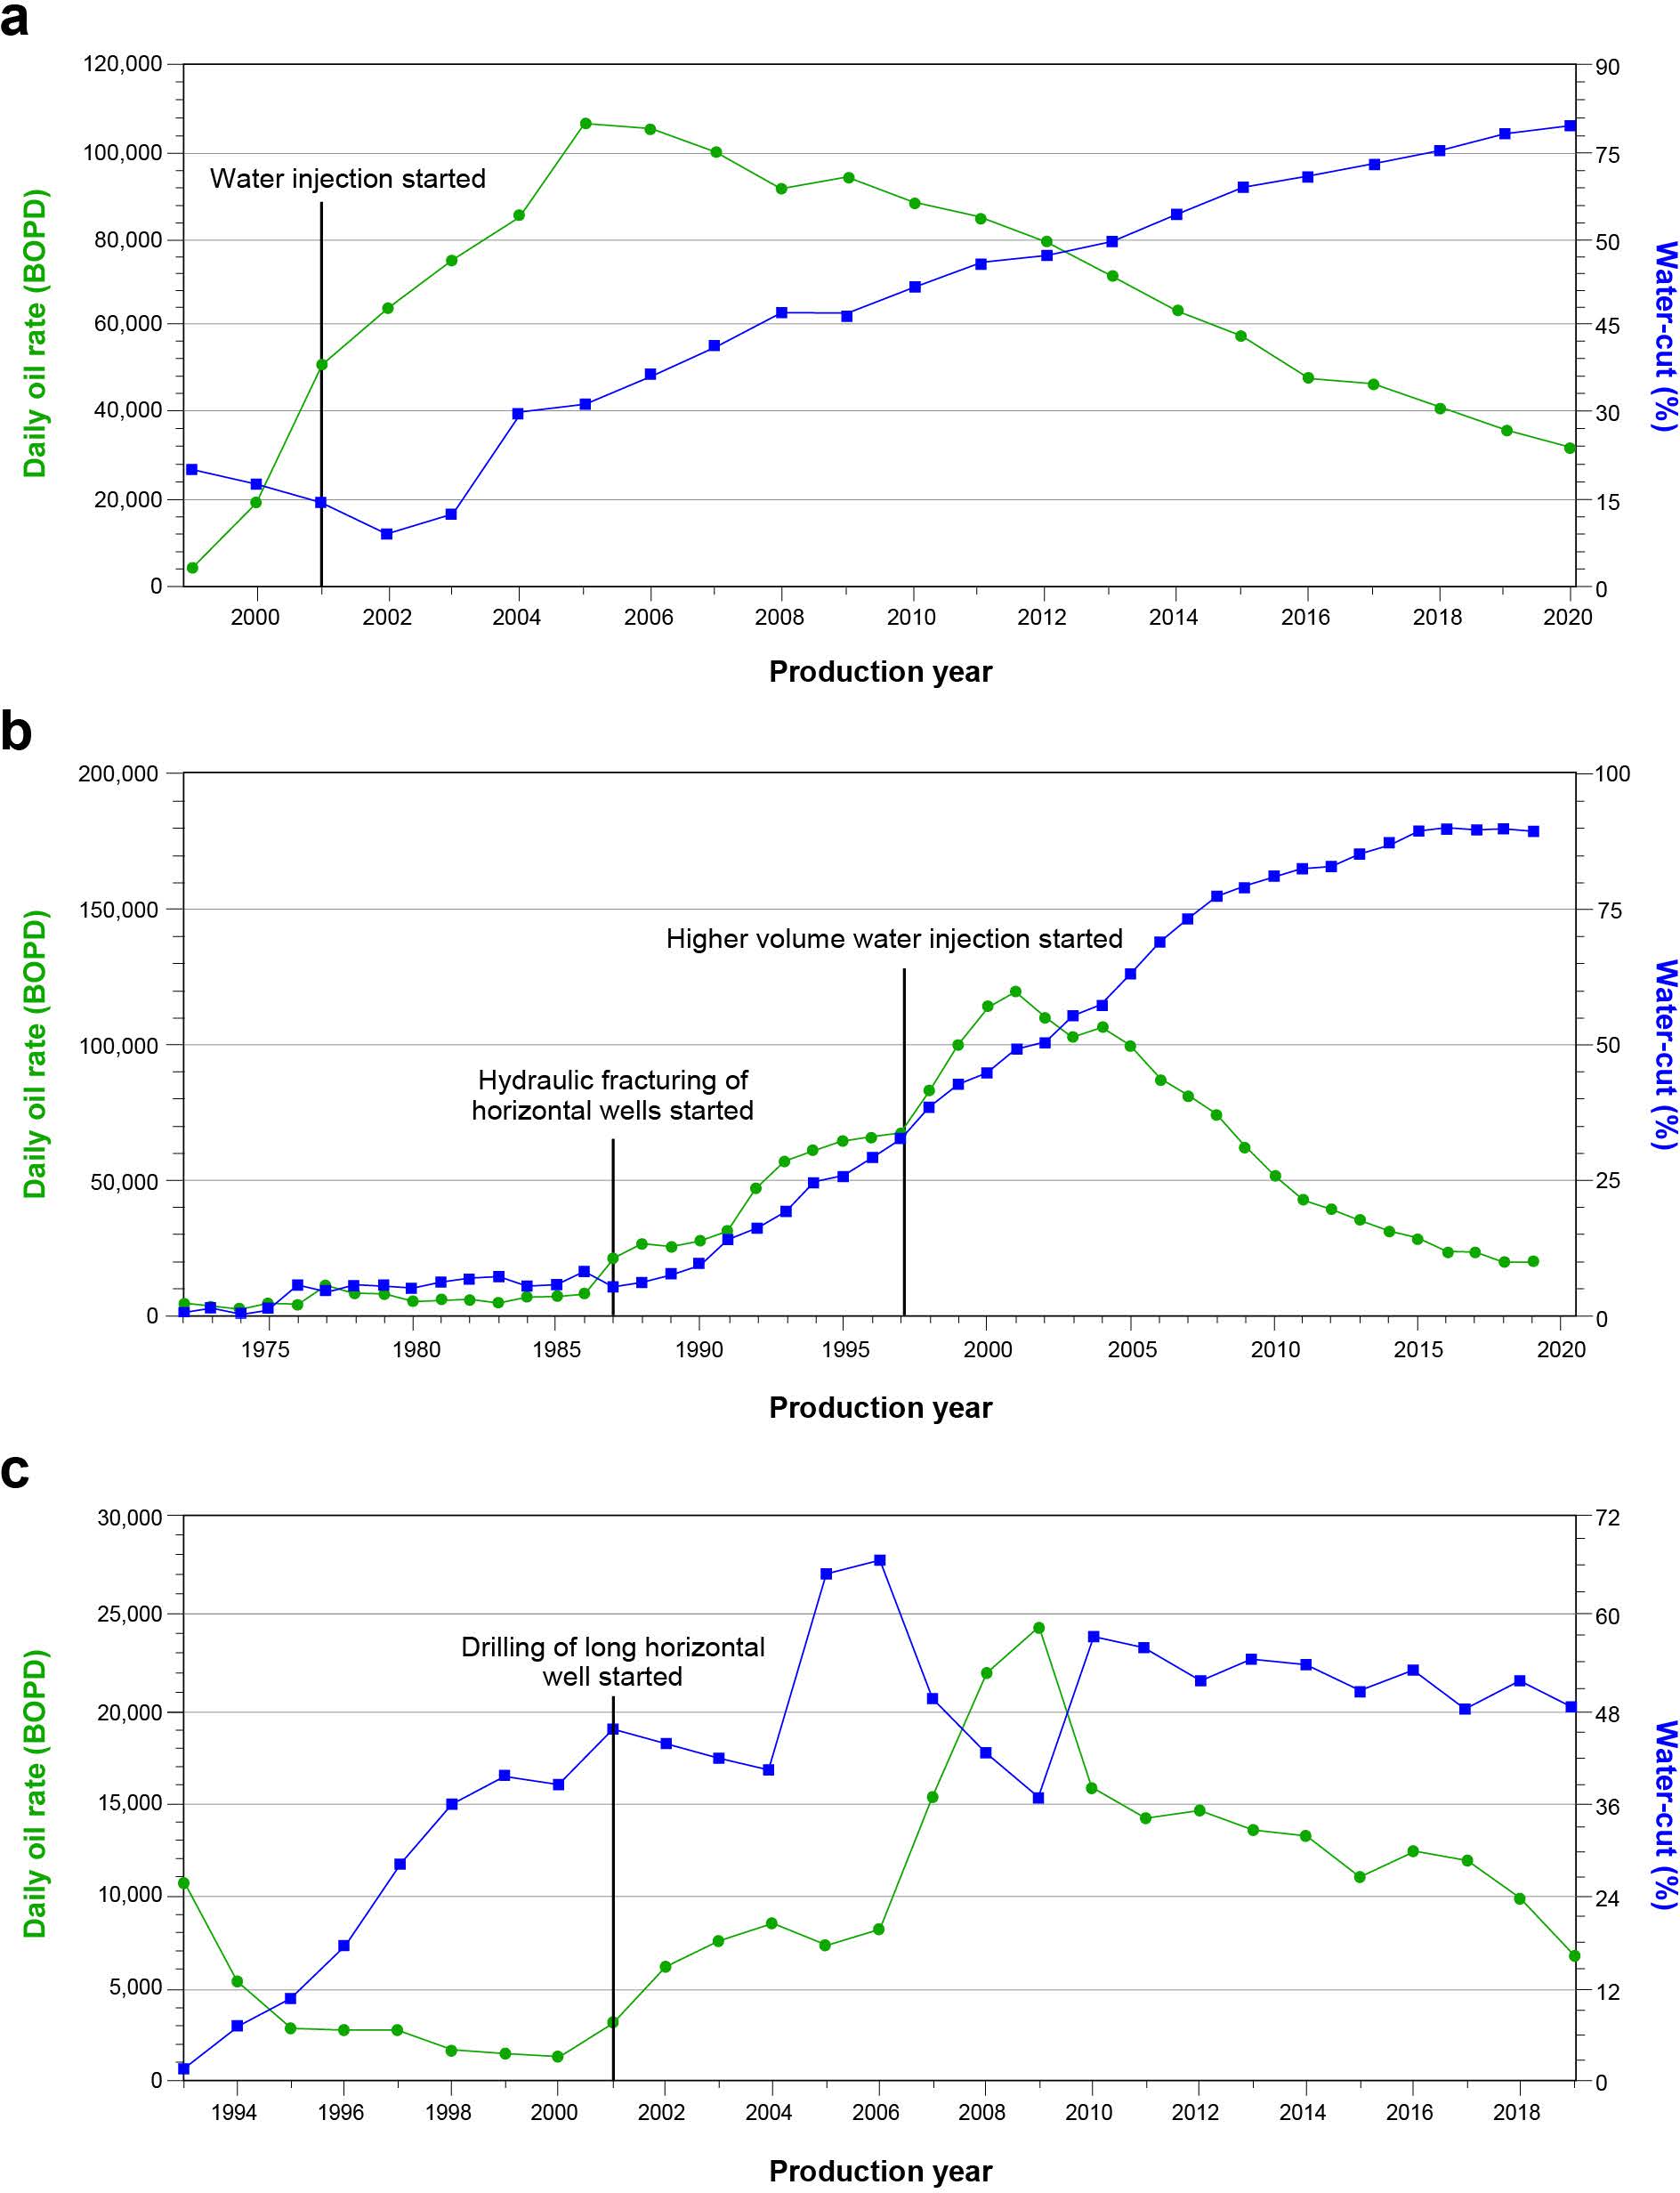
Fig. 5 – Daily oil rate and water-cut performance for three Danish chalk reservoirs: (a) Upper Cretaceous-Paleocene Chalk Group, Halfdan Field; (b) Upper Cretaceous-Paleocene Chalk Group, Dan Field; and (c) Lower Cretaceous Tuxen-Sola Formation, Valdemar Field.
Key Insights
1. Better-performing analogues in the data set are all water-wet, and water injection has been applied for pressure maintenance.
2. Selective injection, water plugging, and modification of injection patterns are the most common conformance-improvement techniques used to control water production and improve waterflood performance (Table 4).
3. Other effective reservoir management practices include line-drive water injection patterns with producer and injector lines oriented parallel to dominant fault/fracture networks, selective and intelligent completions to isolate fracture zones and high water-cut production legs, and control of water injection rate (Table 4).
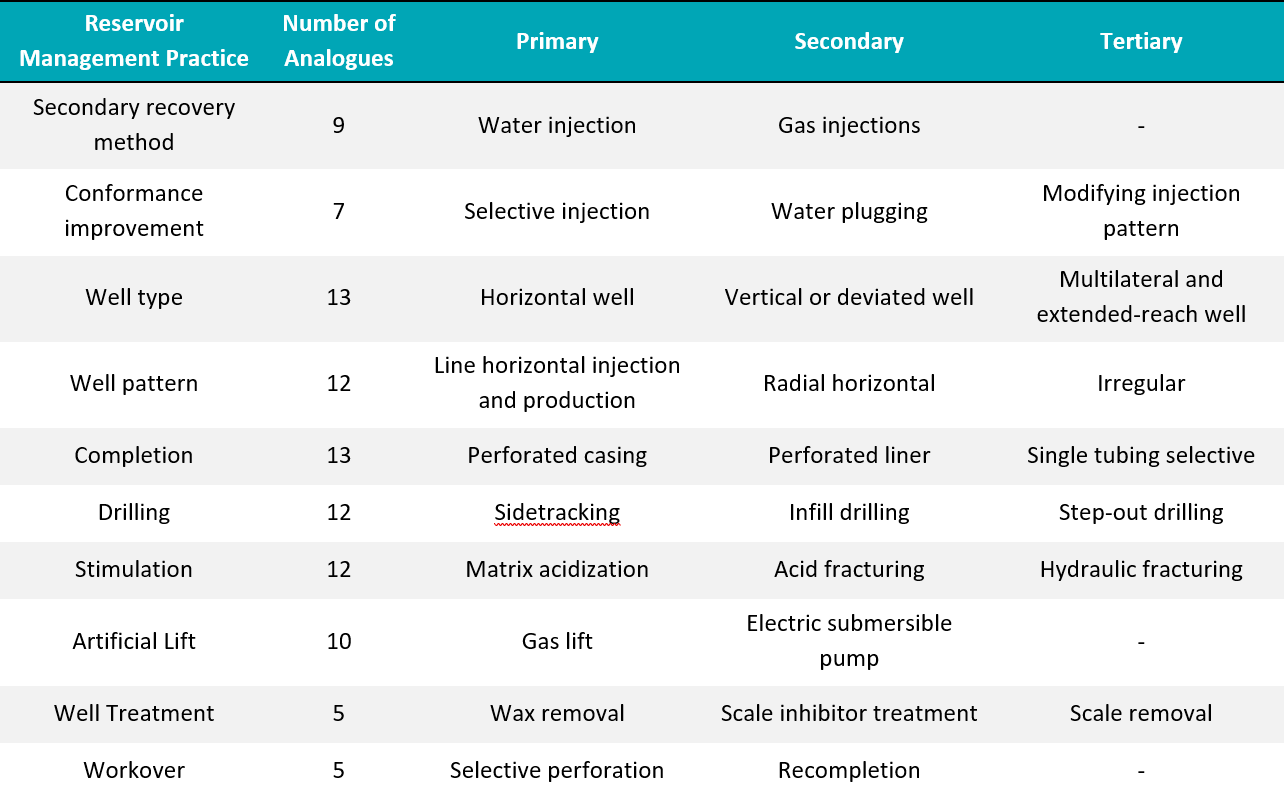
Table 4 – Effective reservoir management practices for the 13 offshore fractured microporous oil reservoirs, ordered in terms of importance (primary through tertiary).
4. Stimulation by acid or hydraulic fracturing with sand proppant to keep fractures open has proved effective in improving well productivity for the low permeability, poorly fractured reservoirs. Incremental recovery for continuous water injection ranges between 8 and 28% with an average of 16% (Fig. 6).
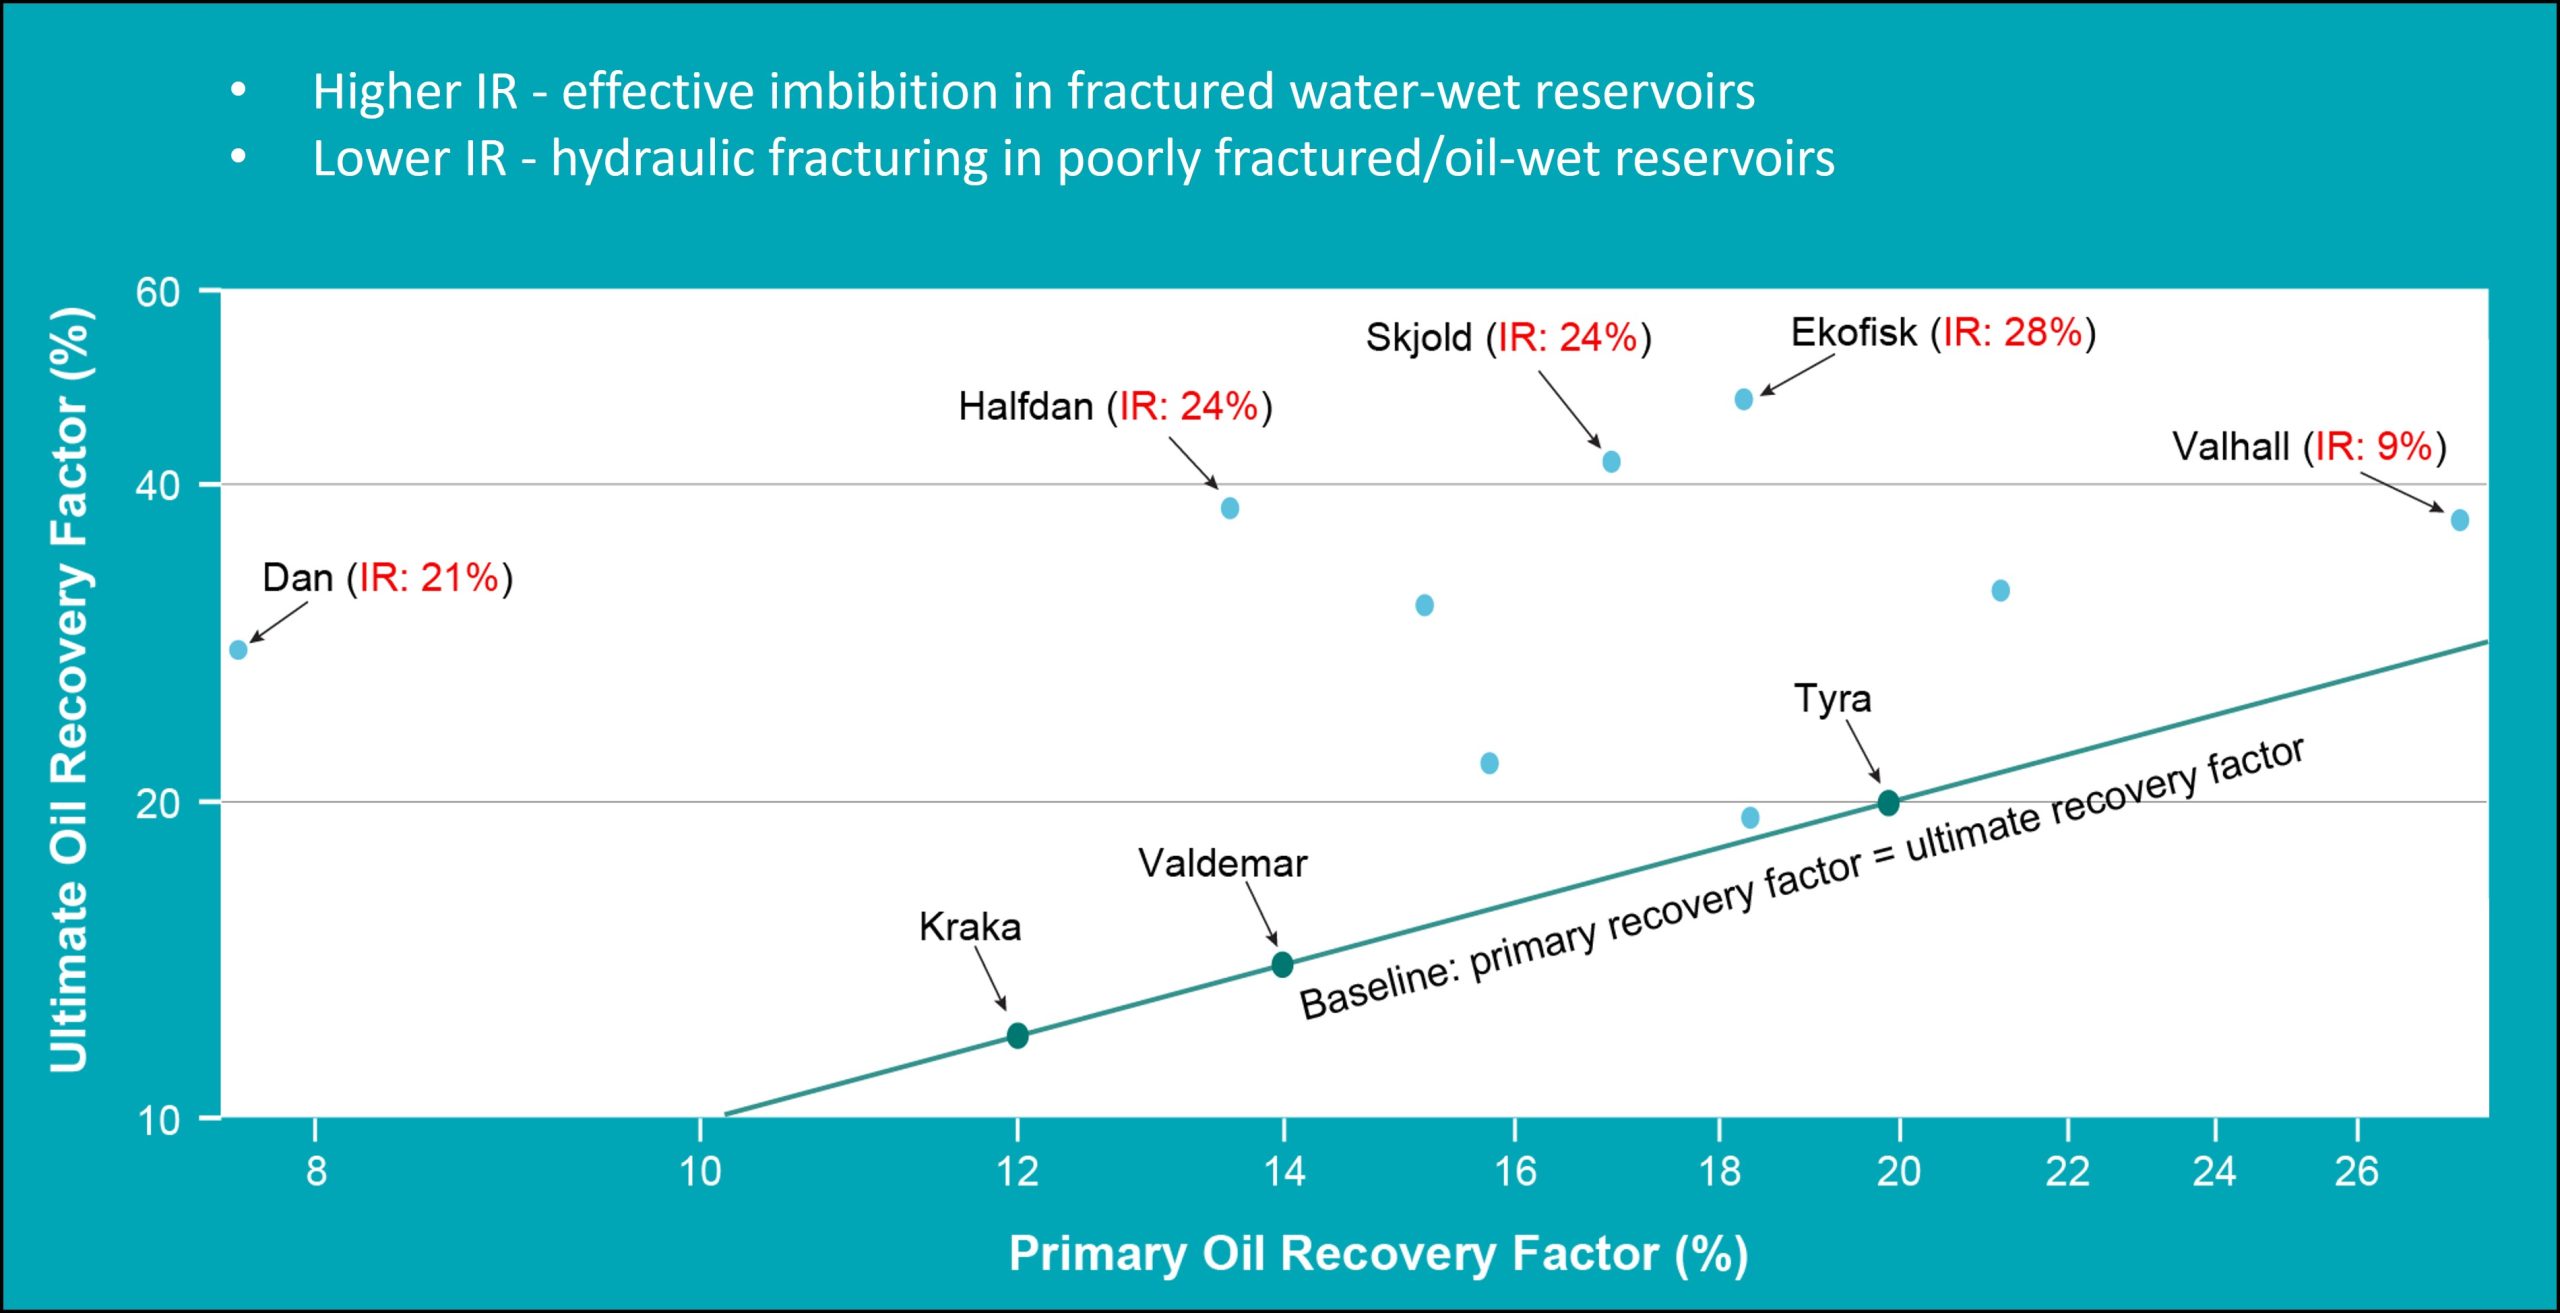
Fig. 6 – Estimated primary recovery factor versus ultimate recovery factor crossplot for 12 offshore fractured microporous oil reservoirs for which reliable data are available. Successful implementation of water injection is key to realizing higher ultimate recovery factor.
Conclusions
In this study, DAKS has proved that Benchmarking against the analogue recovery trends demonstrates an upside recovery potential of 16% and not 10% as previously thought, and presents best practices and lessons learnt to help improve recovery. This study presents an empirical analogue benchmarking workflow that is based upon systematic analysis of more than 1,600 reservoirs from around the world. The workflow is designed for effective, practical, and repeatable application of analogue analysis to all reservoir types, development scenarios, and production challenges. Using this workflow, practitioners can identify upside recovery potential in producing assets efficiently and replicate the best practices used at top-performing analogues. This workflow is intended to introduce a simple, practical, and effective solution to removing the bias that currently exists in the use of analogue information.
References
Lafond, K. B., Pedersen, L. M., Christiansen, L. B. et al. 2010. FAST Optimization of Line-Drive Water Injection. Paper presented at the SPE Europec/EAGE Annual Conference and Exhibition, Barcelona, Spain, 14–17 June. SPE-130471-MS. https:// doi. org/ doi: 10. 2118/ 130471- MS.
Larsen, F. P., Cowie, D. R., and Ovens, J. V. 1997. Using 4000 Ft Long Induced Fractures to Waterflood the Dan Field. Paper presented at the SPE Offshore Europe Conference, Aberdeen, Scotland, 9–12 September. SPE 38558-MS. https:// doi. org/ doi: 10. 2118/ 38558- MS.
Navarro, J. M. and Heer, M. A. 2014. Practical Application of Variable Rate / Variable Pressure Drop Decline Curve Analysis: Valdemar Lower Cretaceous Case History. Paper presented at the SPE Annual Technical Conference and Exhibition, Amsterdam, The Netherlands, 27–29 October. SPE-170591-MS. https:// doi. org/ doi: 10. 2118/ 170591- MS.
Suicmez, V. S. 2019. Feasibility of Hydrocarbon Gas Injection in Valdemar Field of Danish Central Graben in the North Sea. Deu Muhendislik Fakultesi Fen ve Muhendislik 21 (26): 55–66. https:// doi. org/ 10. 21205/ deufmd. 2019216106.
